
Figure 1.
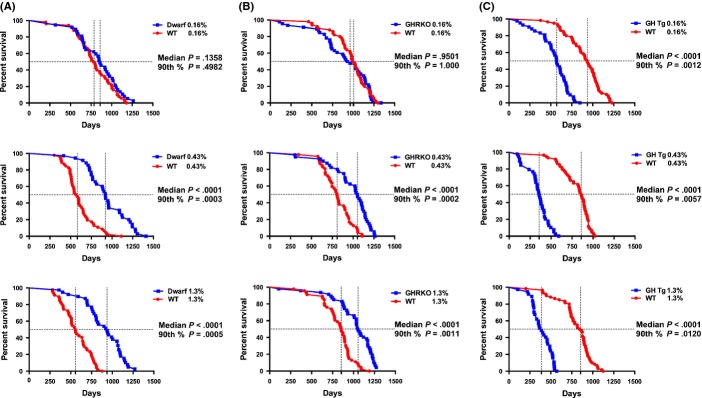
Survival curves for mutant mice on three levels of dietary methionine. (A) Ames dwarf and wild-type mice. (B) GHRKO and wild-type mice. (C) GH transgenic and wild-type mice. Each panel represents the response of the mice to 0.16%, 0.43%, or 1.3% methionine, and symbols represent individual mice. Vertical dashed lines represent median lifespan for each genotype. Median and 90th percentile statistics for genotype are shown on graph. At the time of publication, 1/37 dwarf (1417 days) and 0/50 wild-type mice were alive in the 0.16% group, 0/35 dwarf and 0/46 wild-type mice were in the 0.43% group, and 1/39 dwarf (1359 days) and 0/47 wild-type mice were left in the 1.3% MET group. At the time of publication, 0/45 GHRKO and 0/50 wild-type mice were alive (0.16%), 0/40 GHRKO and 0/44 wild-type mice were in the 0.43% group, and 2/47 GHRKO (1289, 1289 days) and 0/46 wild-type mice were left in the 1.3% MET group. 0/41 GH Tg and 0/60 wild-type mice on the 0.16% MET were alive, 0/39 GH Tg and 0/60 wild-type mice on 0.43% MET were alive, and 0/37 GH Tg and 0/60 wild-type mice were left on 1.3% MET.