
Figure 2.
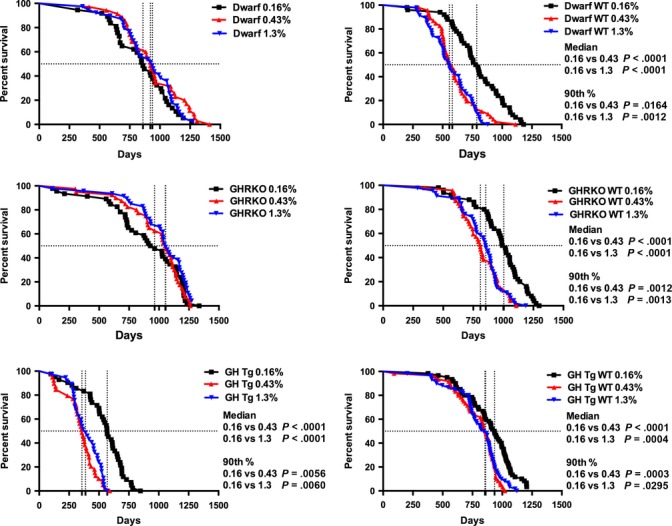
Survival curves for all mice compared across diets within genotype. Each panel represents the genotype response to each level of dietary methionine. Symbols represent individual mice, and vertical lines indicate median lifespan. Median and 90th percentile lifespan differences between diets are indicated.