Figure 5.

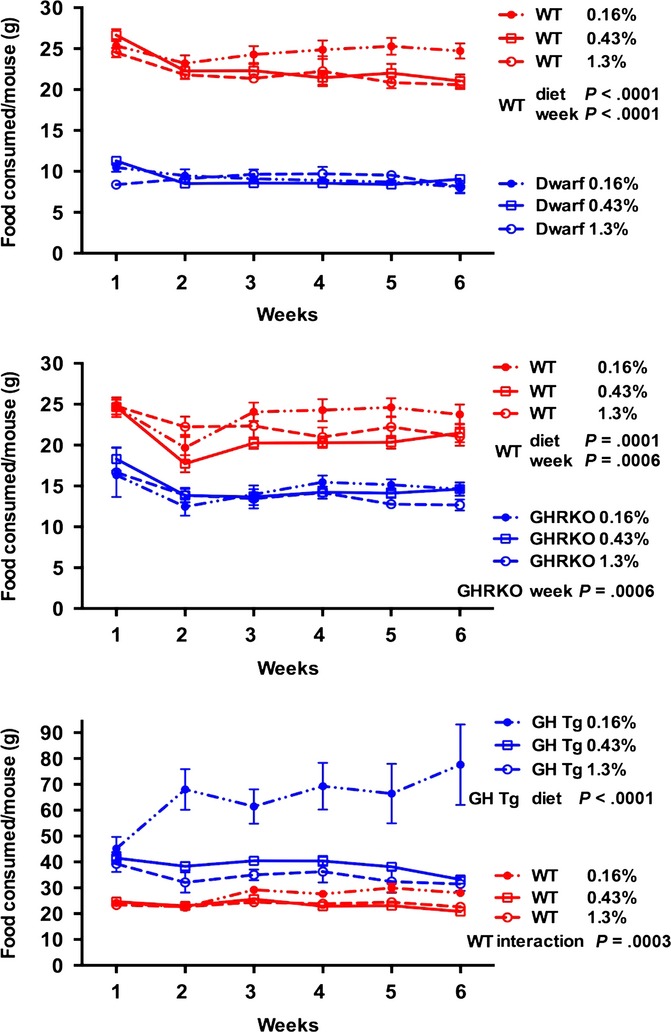
Food consumption per mouse (grams) for each GH mutant and wild-type control on three levels of dietary methionine during the first 6 weeks of study. Each symbol represents the mean ± SEM of all mice in each group.

Food consumption per mouse (grams) for each GH mutant and wild-type control on three levels of dietary methionine during the first 6 weeks of study. Each symbol represents the mean ± SEM of all mice in each group.