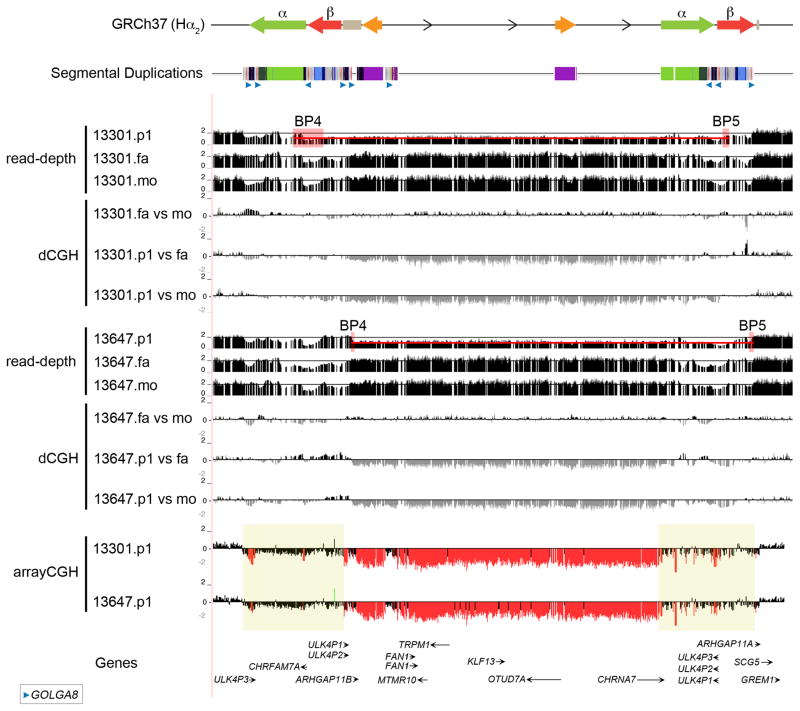
Figure 6. 15q13.3 microdeletion breakpoints analysis.
Array CGH data for two 15q13.3 microdeletion patient samples are mapped against the GRCh37 human reference. The microdeletion breakpoints map within a 500 kbp region (yellow boxes) where both α and β SDs are mapping. Digital comparative genomic hybridization (dCGH)17 was used to detect regions of gain or loss in probands (p1) compared to their parents (mo, mother; fa, father). The method measures differences in Illumina sequence read-depth compared to a reference genome to define sites of copy number variation. Paralog-specific read-depth analysis in each proband and their parents was performed at all sites where both parents had the expected copy number of 2. This allowed us to refine proband 13647.p1 breakpoints to a 13 kbp segment and proband 13301.p1 breakpoints to a 30 kbp between BP4 and BP5 (red boxes). The two probands have different breakpoints but in both cases the breakpoints map at or adjacent to the GOLGA8 repeats.

