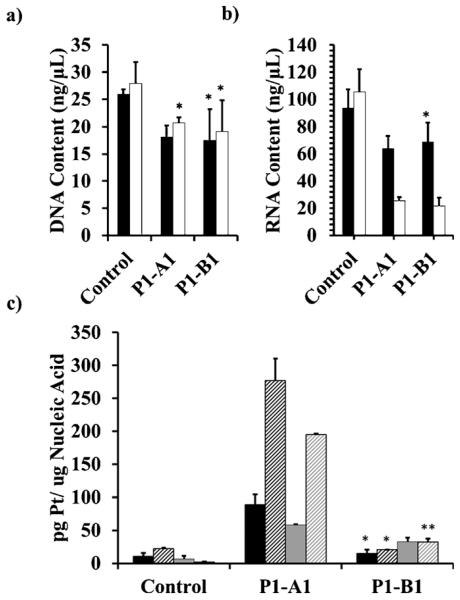
Figure 7.
Amounts of DNA (a) and RNA (b) extracted from untreated NCI-H460 cells and cells treated with 1 mm P1––A1 or P1–B1 for 3 h (black) and 6 h (white). These data were used to determine the Pt/nucleic acid ratio (c) in DNA after 3 h (black) and 6 h (shaded black), and in RNA after 3 h (gray) and 6 h (shaded gray) of continuous dosing. Data with one asterisk (*) displays no statistical difference from control at 95% confidence (α = 0.05). Data with two asterisks (**) displays no statistical difference at 95% confidence (α = 0.05), but displays a statistical difference at 90 % confidence (α = 0.10) when using a two-tailed t-test assuming unequal variances.

