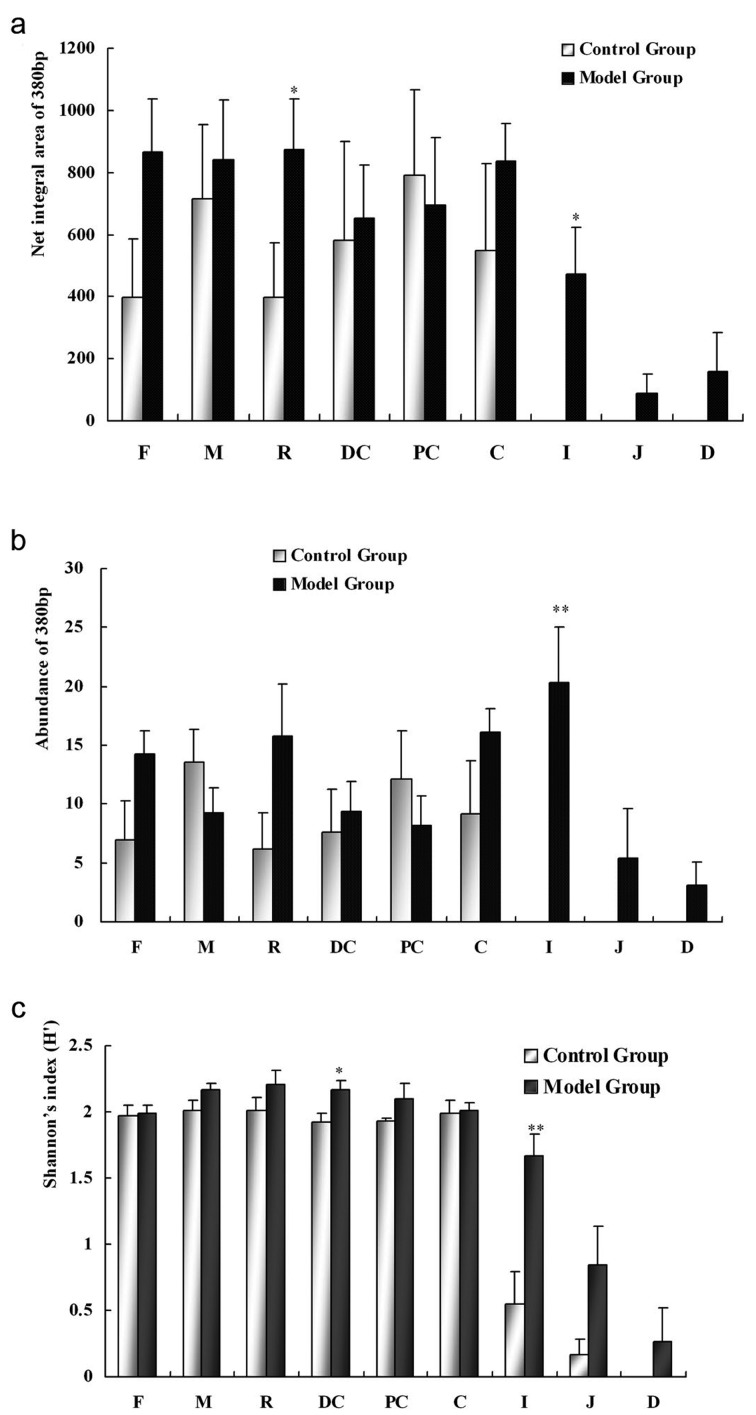
Fig. 2.
Net integral area (a), abundance of the 380 bp product (b) and Shannon index (c) of ERIC-PCR fingerprinting of different samples in the control and model groups after inducement. *P<0.05, **P<0.01, paired samples t-test, contrasted with the control group. F, fecal sample; M, mix of intestinal samples; R, rectum sample; DC, distal colon sample; PC, proximal colon sample; C, cecum sample; I, ileum sample; J, jejunum sample; D, duodenum sample.

