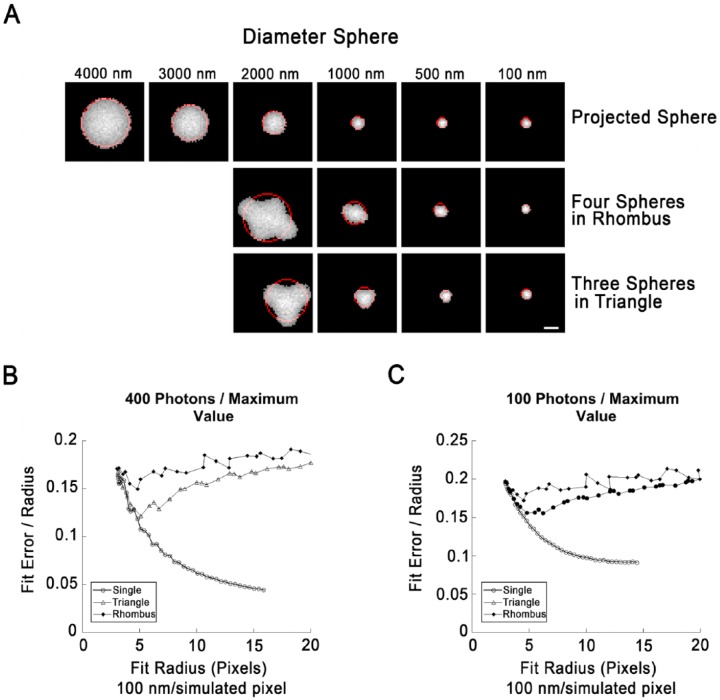
Figure 2.
Fits of circle to boundaries of single lipid droplets (LDs) or LD clusters in simulated images. (A) Illustration of simulated LDs arranged singly (top row) or as indicated. Simulated images were created by projection of a sphere onto a plane, preserving the integrated fluorescence intensity for each 2D pixel. The radius indicated at the top is the radius on the simulated image prior to processing (100 nm/pixel). The objects shown have been subjected to a Gaussian blur to simulate the effects of diffraction, followed by the application of simulated photon shot noise (400 photons/maximum pixel value), and clipping to their full width half maximum (FWHM). The boundary pixels were then extracted and the best-fit circle determined (red). (B) Fit error (SDBFC; standard-deviation best-fit-circle) as a function of fit circle radius for single LDs, clusters of three arranged in a triangle or clusters of four arranged in a rhombus created and processed exactly as described for (A). LDs in clusters were overlapped by 20% to prevent segmentation by the thresholding routine. Each point represents the mean value of 1000 simulations. Error bars are not shown since standard deviation of simulation runs was <0.1% for 100 nm LDs (the smallest size tested) for all three geometries. (C) Fit error as a function of circle radius exactly as in (B) except that shot noise was increased to 100 photons/maximum pixel value. Each point represents the mean of 1000 simulation runs. Standard deviation was <0.2% for 100 nm LDs for all three geometries. Scale, 10 simulated pixels (1.0 simulated µm).

