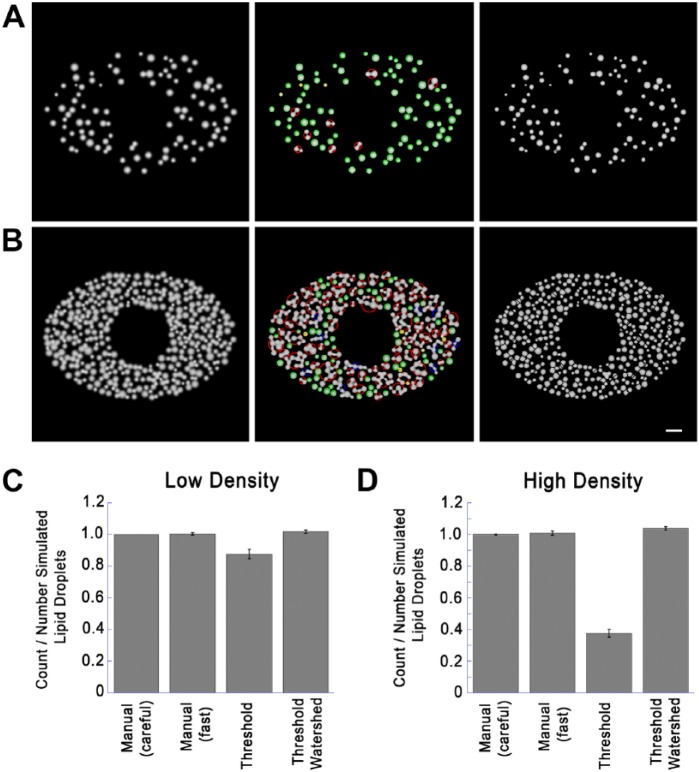
Figure 6.
Comparison of Quantitation Techniques on Simulated Images. (A) Low density simulated cell images created with a low density of lipid droplets (LDs; 20% of cell area covered, as described in detail in the text. Left image shows the image before processing. Middle image is after thresholding and testing for circularity. Green and yellow circles indicate structures accepted as circular, exactly as in Figure 4. Red and blue circles indicate structures not accepted as circular, and passed to the watershed routine for further segmentation. Right image is a composite showing circular structures without further processing and non-circular structures segmented by setting watershed boundaries to zero. (B) Simulated image was created and processed identically as in the panels in (A) but with LDs added until 70% of the usable area was covered (high density). Left panel shows the original image. Middle image shows identification of circular and non-circular structures color-coded as in (A). Right image is a composite showing circular structures without further processing, and non-circular structures segmented by setting watershed boundaries to zero. (C) Ten low-density images were created exactly as described for the left panel in (A) with random LD patterns (20% of usable image area covered). The number of simulated LDs was recorded for each image, and LD number was then determined as indicated. Shown for each condition is the mean ± SD of counted/actual LDs. Details on each method used are described in the text. (D) Ten high-density images were created and processed exactly as described for the left panel in (B) (70% of simulated cytoplasm covered). LD count was then determined by the indicated techniques as described for (C) and divided by the number LDs rendered. Shown is the mean ± SD of counted/actual LDs. Micron bar 50 pixels (5 simulated µm).

