
Figure 7.
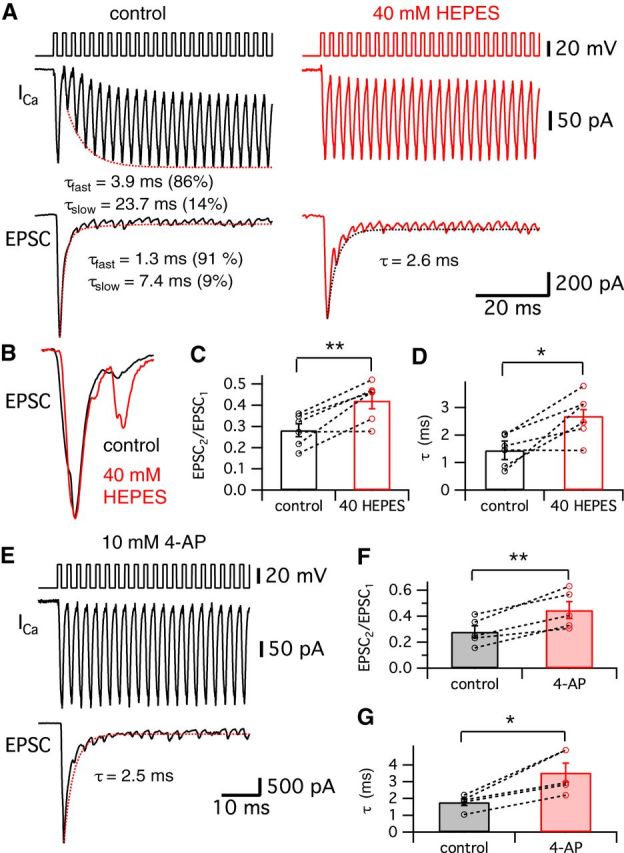
Effects of released H+ ions on EPSC amplitudes during a 400 Hz train of stimuli. A, Hair cells were stimulated by a train of 1 ms depolarizing pulses from −60 to −30 mV with an interpulse interval of 1.5 ms. A total of 40 stimuli were given at 400 Hz for 100 ms. Ca2+ currents showed a transient block with a double exponential recovery (dashed line; τfast = 3.9 ms and τslow = 23.7 ms) in control (left). EPSCs evoked by the 400 Hz train of pulses showed depression (dashed line; τfast = 1.3 ms and τslow = 7.4 ms). After perfusion of the external solution with added 40 mm HEPES (right), the hair cell Ca2+ currents do not show the transient block and the corresponding EPSCs show depression with a single exponential time constant (τ = 2.6 ms). B, EPSCs in control (black) and 40 mm HEPES (red) were normalized and superimposed. The second and third EPSCs become larger when 40 mm HEPES removed the transient block in the Ca2+ currents. Note that the second EPSC (arrow) was significantly larger with 40 mm HEPES than in control. C, The ratio of the first and the second EPSCs (EPSC2/EPSC1) in control (black) and with 40 mm HEPES (red). EPSC2/EPSC1 with 40 mm HEPES was significantly increased (0.42 ± 0.04) compared with that in control (0.28 ± 0.03; n = 6). D, From 6 pairs, the average τ of the EPSC peaks in 40 mm HEPES (red, 2.6 ± 0.3 ms) was significantly increased compared with control (black, 1.4 ± 0.2 ms). E, When hair cells were stimulated by a 400 Hz train of 1 ms depolarizing pulses from −60 to −30 mV, an external solution with 10 mm 4-AP removed the transient block in Ca2+ currents and slowed the kinetics of the EPSC train depression (fit with a single exponential time constant: τ = 2.5 ms). F, EPSC2/EPSC1 in control (black) and with 10 mm 4-AP (red). EPSC2/EPSC1 with 10 mm 4-AP was significantly increased (0.45 ± 0.06) compared with that in control (0.28 ± 0.05; n = 5). G, From 5 pairs, the average τ of the EPSC peaks in 10 mm 4-AP (red, 3.5 ± 0.6 ms) was significantly increased compared with control (black, 1.8 ± 0.2 ms). *p < 0.05, paired t test; **p < 0.01, paired t test. Open circles indicate individual pairs.