Figure 2.
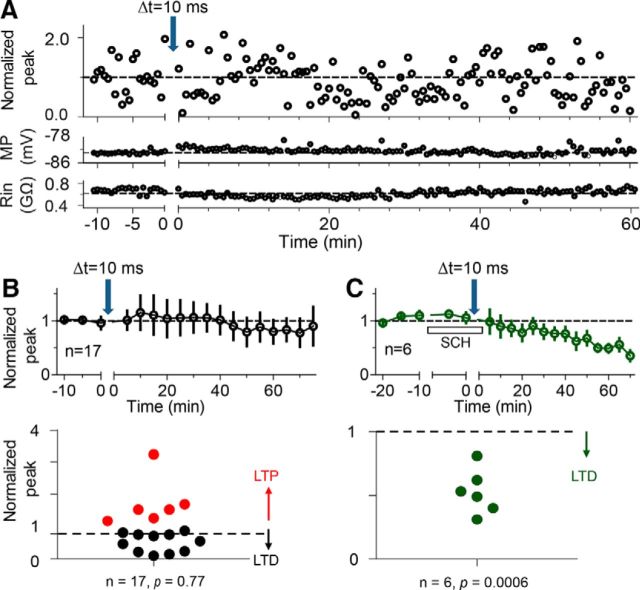
Consequences of the STDP protocol with Δt = 10 ms. A, An example time course and magnitude of the synaptic strength induced by the Δ t = 10 ms protocol (top). All data points were normalized to the mean baseline value. The corresponding membrane potential (MP) (middle) and input resistance (Rin) (bottom) are plotted on the same time course. B, C, Summary point diagrams showing alterations in synaptic efficacy produced by the Δt = 10 ms protocol (at the downward arrow) in all granule cells recorded in the absence (black data) and presence (green data) of 20 μm SCH (D1-type receptor antagonist), respectively. Average of normalized peak values counted per 3 min or 5 min bin for prestimulation baseline and poststimulation period, respectively (top). Population graph illustrating the magnitude of synaptic change induced by the same Δt = 10 ms protocol (bottom).

