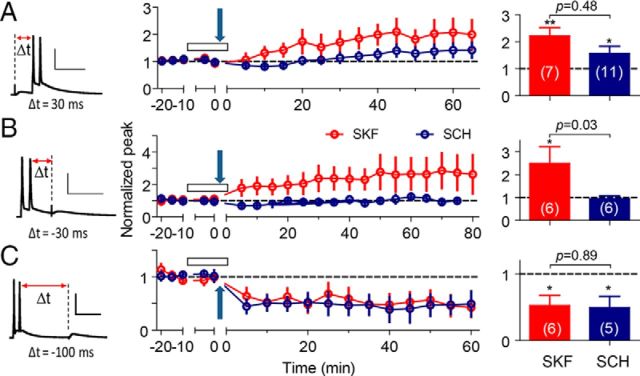
Figure 4.
tLTP induction in the presence of either 30 μm SKF or 20 μm SCH. The tLTP induced by the protocols with Δt = 30 ms (A), −30 ms (B), and −100 ms (C). The induction protocols are illustrated in the left column. Calibration: 50 pA, 50 ms. The time course and magnitude of the alterations in synaptic strength are shown as normalized peak amplitude in the middle column. The quantified summaries of the statistical analysis are shown in right column. The arrows indicate the application of the STDP protocols, and the open bars indicate the period of drug application. *p < 0.05, **p < 0.01 compared with the baseline; the p values indicate the statistical significance between the indicated two groups.

