Figure 5.
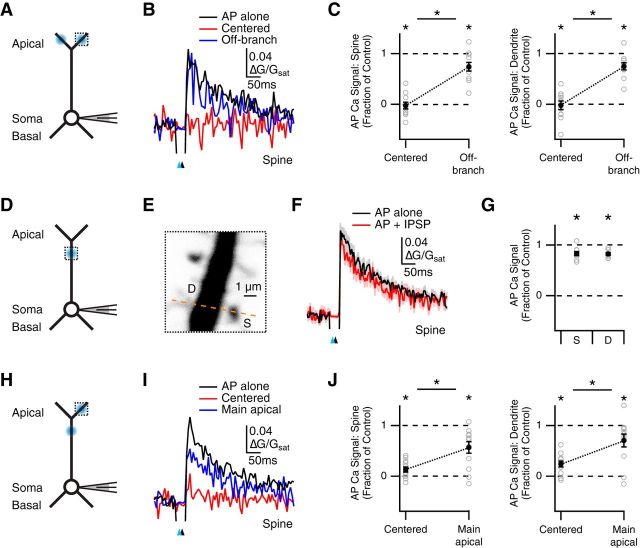
Restricted inhibition across dendritic compartments. A, Schematic of recording configuration, where blue spots indicate GABA uncaging at centered or off-branch locations, and the dotted box indicates location of imaged spines and dendrites. B, Average Ca2+ signals evoked in apical spines by AP alone (black) or AP paired with GABA uncaging at the centered location (red) or off-branch location (blue), where the blue arrow indicates uncaging pulse and the black arrow indicates AP firing at 10 ms delay. C, Summary of impact of GABA uncaging at each location on AP Ca2+ signals in spines (left) and dendrites (right). *p < 0.025. D, Similar to A with GABA uncaging and imaging at the main apical dendrite. E, Magnified view of main apical dendrite with imaged spine (S), dendrite (D), and line-scan path (dashed line). F, Average Ca2+ signals evoked in main apical spines by AP alone (black) or AP paired with GABA uncaging (red). G, Summary of impact of GABA uncaging on AP Ca2+ signals in main apical spines (left) and dendrites (right). *p < 0.05. H–J, Similar to A–C with GABA uncaging at either the imaging location or the main apical dendrite. *p < 0.025.

