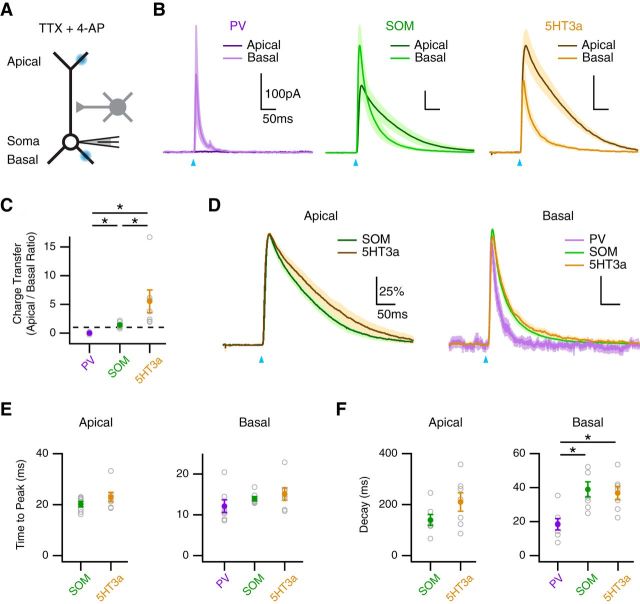
Figure 8.
Subcellular targeting of multiple interneurons. A, Schematic of recording configuration, where blue spots indicate local illumination of ChR2-expressing presynaptic terminals at the apical or basal dendrites in the presence of TTX and 4-AP. B, IPSCs evoked by local activation of PV (left), SOM (middle), and 5HT3a (right) inputs at the apical (dark) and basal (light) dendrites, where blue arrows indicate light pulse. C, Summary of the ratio of IPSC charge transfer at the apical and basal dendrites for each interneuron, where the dashed line equals unity. *p < 0.025. D, Peak-scaled IPSCs evoked by each interneuron at the apical (left) and basal (right) dendrites. E, F, Summary of time to peak (E) and decay (F) of IPSCs evoked by the different interneurons at the apical (left) and basal (right) dendrites. *p < 0.025.

