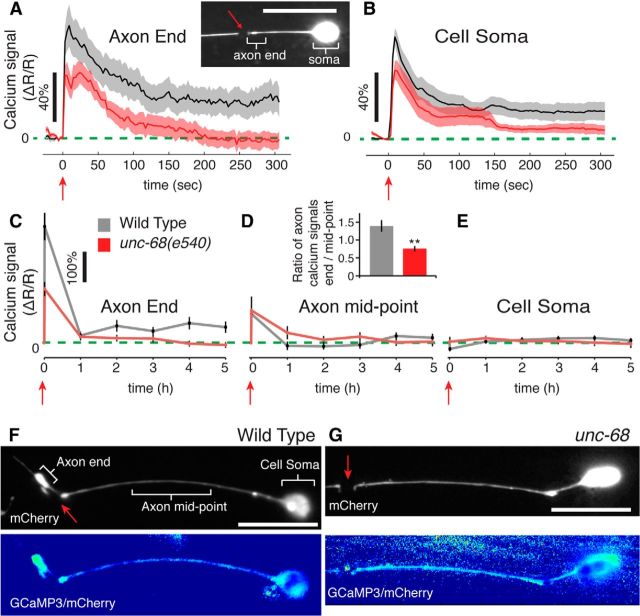
Figure 3.
Subcellular calcium signals in a regenerating neuron. The localized average calcium signal within axotomized ALM neurons measured across the specified cellular regions of interests for (A, B) the immediate 0–300 s following laser axotomy 20 μm from the cell soma or (C–E) the 0–5 h following laser axotomy 60 μm from the cell soma. Shaded regions and error bars indicate SEM. D, Inset, Ratio of calcium signals at the axon end to those at the mid-point averaged for data taken from 1 to 5 h. **p < 0.001 (t test). F, G, Representative images showing subcellular calcium signaling in severed ALM axons for wild-type (at 4 h) and unc-68(e540) (at 3 h). Top, mCherry images alone. Bottom, Ratiometric images. Intensity indicates relative calcium levels (see Materials and Methods). Red arrows indicate time or position of laser damage. Scale bars, 20 μm.

