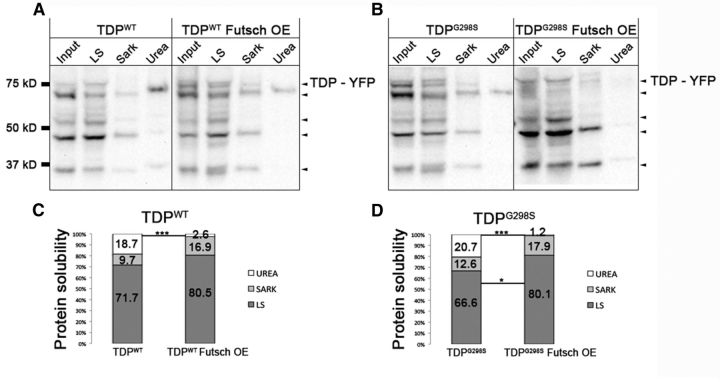
Figure 6.
TDP-43 aggregates are significantly decreased by Futsch OE. A, B, Solubility studies using third instar larvae show the distribution of TDP-43 variants WT (A) and G298S (B) in LS, Sarkosyl (Sark), and urea fractions alone in the context of Futsch overexpression (Futsch OE). C, D, Quantification of WT (C) or G298S (D) TDP-43 levels in LS, Sark, and urea fractions normalized to input. *p < 0.05; ***p < 0.001, Fisher's exact test.

