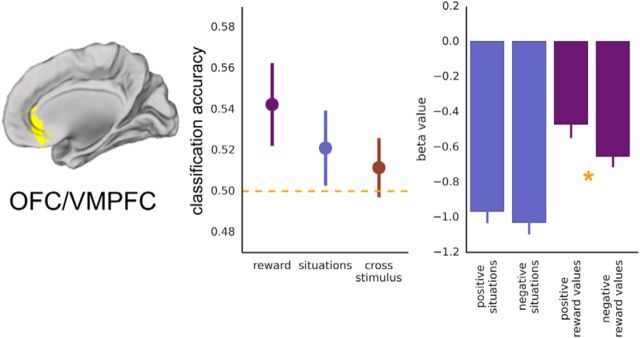
Figure 7.
OFC/VMPFC. Results from anatomical OFC/VMPFC reward ROI (Bartra et al., 2013; Clithero and Rangel, 2013). Left, Classification accuracy for reward outcomes (purple), for situation stimuli (blue), and when training and testing across stimulus types (red). Chance equals 0.50. Right, Mean β values in the ROI for each stimulus condition, asterisk indicates significant difference (p < 0.05).

