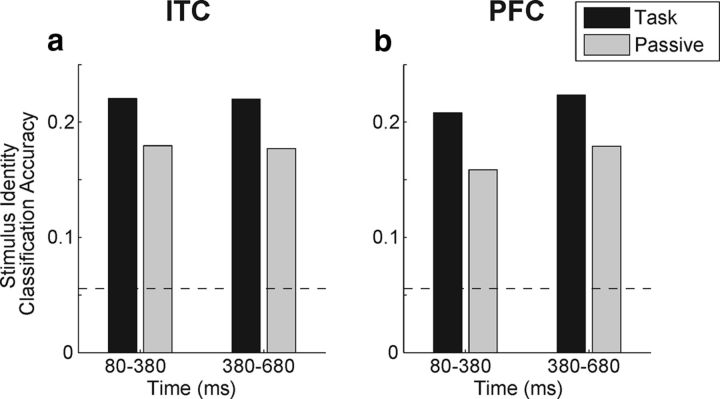
Figure 10.
Classification of stimulus identity during category task and passive viewing. a, b, Bar plots show average performance of the stimulus identity decoder in two time windows for the category task (black bars) and passive viewing (gray bars) in ITC (a) and PFC (b). Horizontal dashed lines represent chance performance of the classifier.

