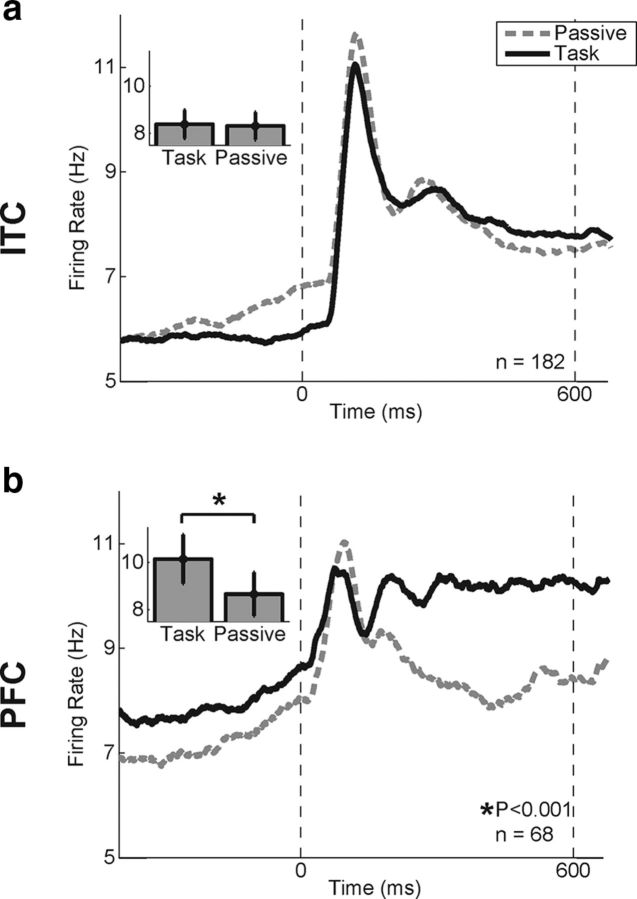
Figure 4.
Population peristimulus time histogram during category task and passive viewing. a, b, Average activity of all stimulus selective ITC (a) and PFC (b) neurons during the category task (solid trace) and passive viewing (dashed trace). Time is from the onset of the sample stimulus. The dotted vertical lines correspond to the time of sample onset (left) and offset (right). Insets show the mean sample-period activity during the two tasks. Error bars represent SEM. *p < 0.001 (2-way ANOVA, simple main effect of task).

