
Figure 5.
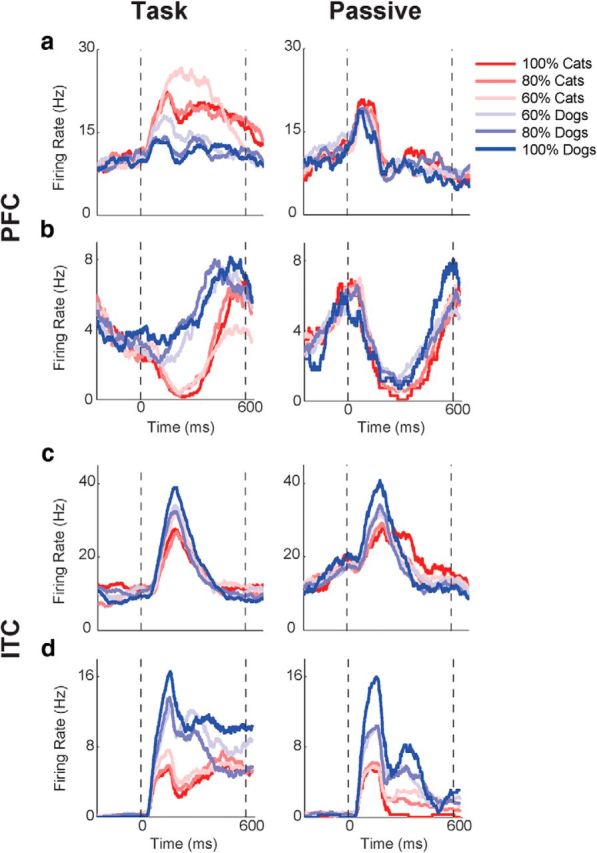
Individual neuron examples. Mean firing rates of single neurons to morphs that are different distances from the category boundary. Colors represent cats (red) or dogs (blue), with the shade corresponding to the relative contribution of that prototype (e.g., red is 100% cat; pink is 60% cat). a–d, The responses of two PFC neurons (a, b) and two ITC neurons (c, d) are shown during both the category task (left) and passive viewing (right). Time is from sample onset. The dotted vertical lines correspond to the time of sample onset (left) and offset (right).