
Figure 6.
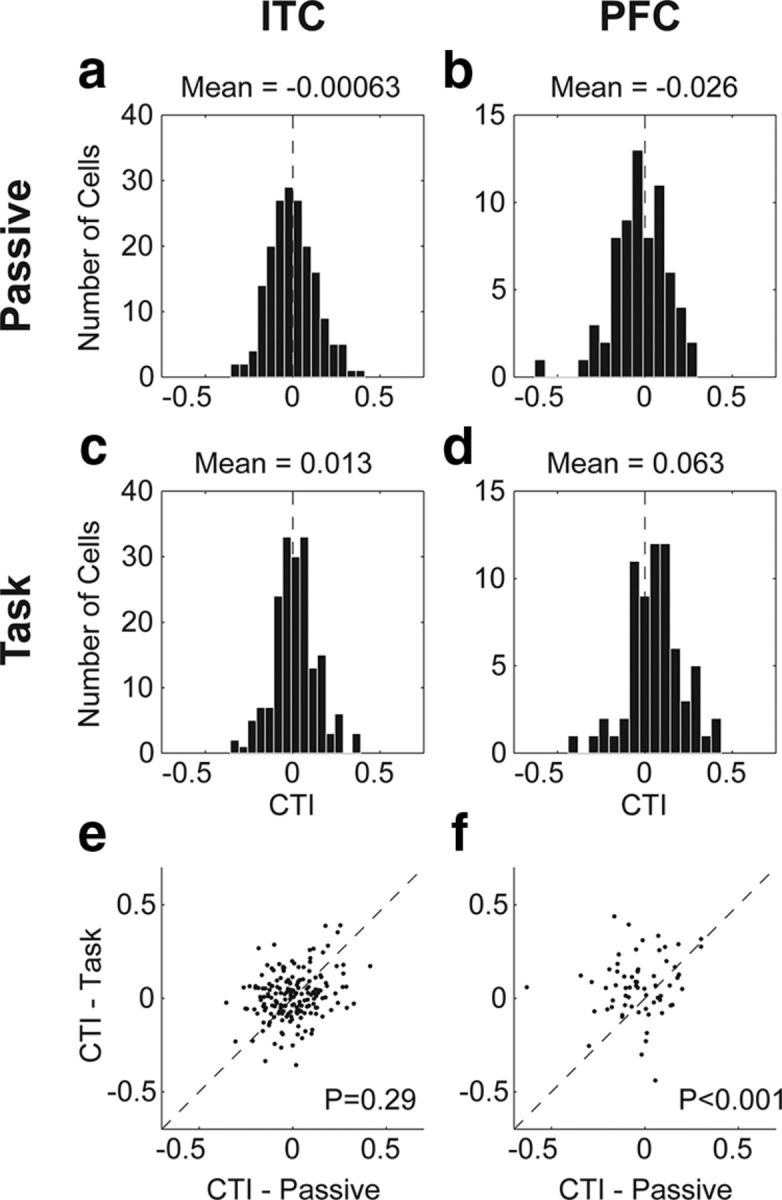
CTI values during category task and passive viewing. a–d, Histograms of the distributions of CTI values during passive viewing and the category task for ITC (a and c, respectively) and PFC (b and d, respectively). e, f, Scatter plots of CTI values during the category task versus passive viewing for each neuron are shown for ITC (e) and PFC (f). p values are from a task versus passive paired t test.