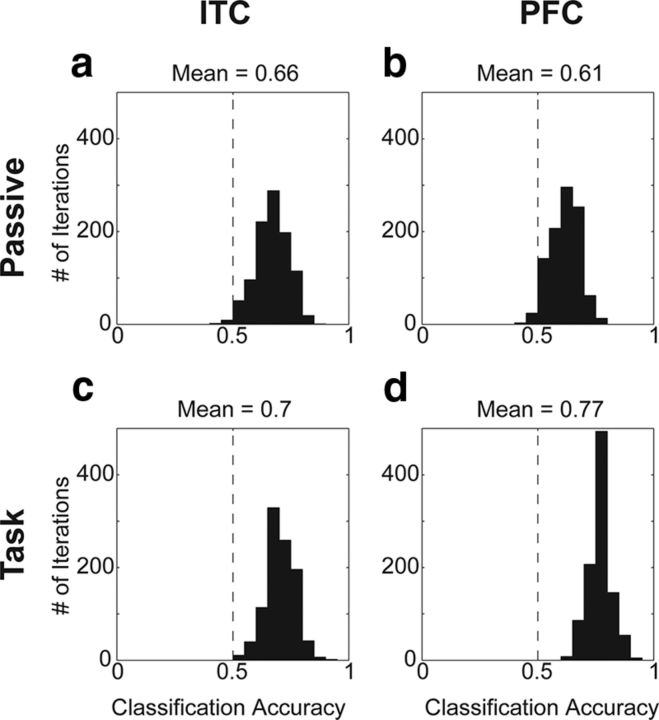
Figure 8.
Population classification of stimulus category during category task and passive viewing. a–d, Histograms of the distributions of classification accuracies across 1000 iterations of the classifier for passive viewing and the category task in ITC (a and c, respectively) and PFC (b and d, respectively). The distribution of classification accuracies during the category task is significantly greater than during passive viewing only in PFC (bootstrap, p < 0.05). The vertical dotted line at 0.5 indicates the chance (0.5) level.

