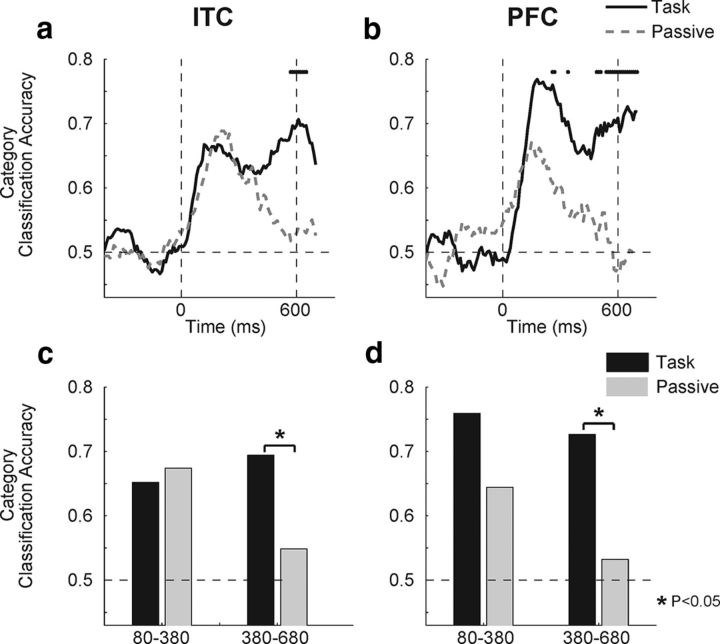
Figure 9.
Time course of category classification during category task and passive viewing. a, b, Plots show a sliding window analysis of category classification accuracy in ITC (a) and PFC (b) during the category task (solid lines) and passive viewing (dashed lines). Horizontal dashed lines on all plots represent chance performance of the classifier. The dotted vertical lines correspond to the time of sample onset (left) and offset (right). Dots along the top of a and b indicate time points where the two traces are significantly different (bootstrap, p < 0.05). Time points along the horizontal axis correspond to the center of the analysis window. c, d, Bar plots show mean classification accuracies in early and late sample epochs for ITC (c) and PFC (d) during the category task (black bars) and passive viewing (gray bars). *p < 0.05 for a task versus passive bootstrap test (2-tailed).

