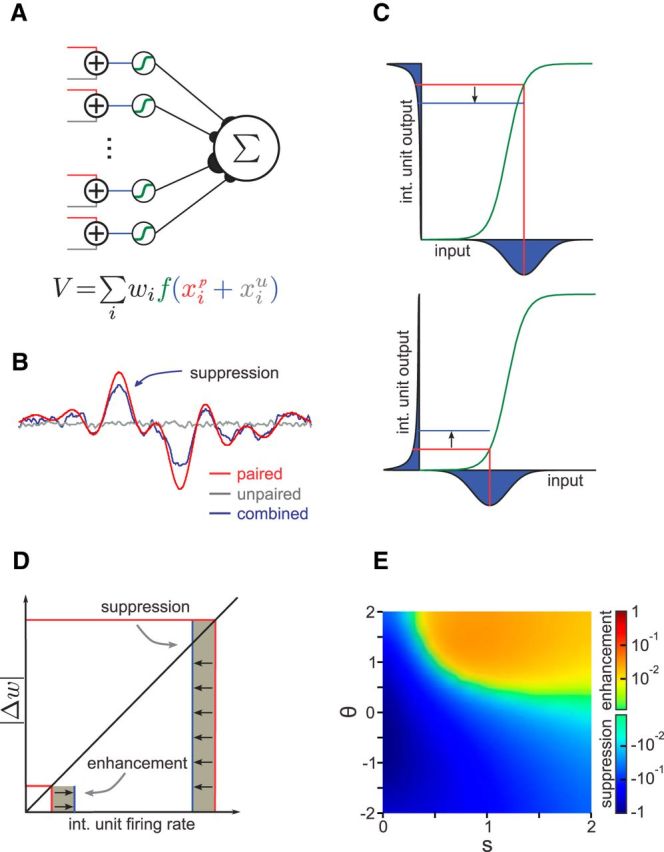
Figure 4.

Network model with randomly combined inputs and nonlinear processing. A, Model schematic. The paired (red) and unpaired (gray) inputs are added and passed through an intermediate layer containing a sigmoid nonlinearity (green). The network output is the weighted sum of the outputs of the intermediate layer units. B, Simulation results when the network fits an arbitrary function with only the paired inputs active but is tested in three cases: (1) paired inputs only (red); (2) unpaired inputs only (gray); and (3) both inputs combined (blue). The unpaired input suppresses the learned response of the network to the paired input. C, Interaction between the paired and unpaired inputs to an intermediate layer unit, with a sigmoid nonlinearity (green). The paired input value and resulting output are indicated by vertical and horizontal red lines, respectively. For the given paired input value (vertical red lines), the distributions (over values of the unpaired input) for the combined input (x-axis) and resulting combined output (y-axis) are shown in blue. The blue line indicates the mean output in the combined case. Top, When the paired input falls within the concave region of the nonlinearity (above the threshold), the output distribution is skewed such that the mean combined output is below the response to the paired input alone. Bottom, When the paired input falls within the convex region of the nonlinearity (below the threshold), the output distribution is skewed such that the mean combined output is above the response to the paired input alone. int., Intermediate layer. D, Contributions of the intermediate layer interactions shown in C to network output. The contribution to the change in network output (shaded area) is given by the product of the change in weight and the firing rate. Because the magnitude of the learned weight change is proportional to the firing rate, the suppression of high firing rates by the unpaired input has a larger effect on the learned response of the network than the enhancement of low firing rates. E, Parameter dependence of suppression/enhancement effects. The effect of suppression is stronger and favored for either low thresholds (θ) and/or narrow nonlinearity widths (s). The threshold and width are in units of the paired input SD, with a threshold value of 0 corresponding to the mean of the training input distribution. Values are plotted relative to the maximum effect magnitude on a logarithmic scale (see Materials and Methods).
