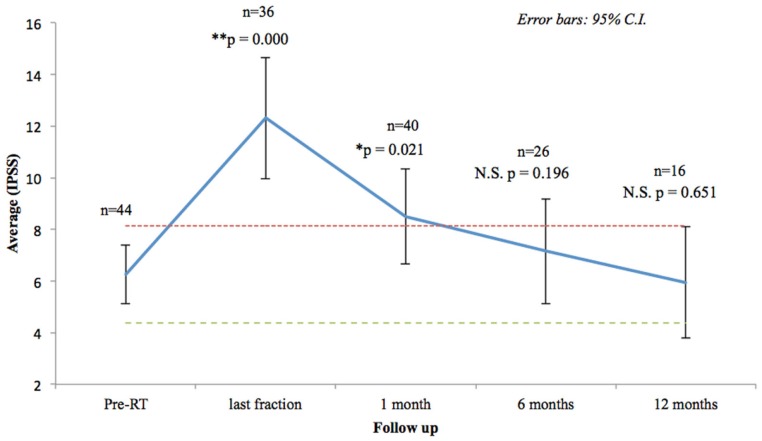
Figure 2.
Urinary quality of life (IPSS questions 1–7). The scores range from 0 to 35 with higher values representing worsening urinary symptoms. Numbers above each time point indicate the number of observations contributing to the average. The thresholds for minimally important clinical differences (MID) are marked with dashed lines.

