
Table 3.
Locations of brain areas showing an interval decrease in cerebral glucose metabolism after therapy in patients with a therapeutic response of CR
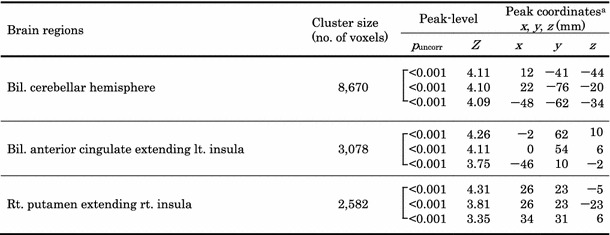
p < 0.005, uncorrected for multiple comparisons
a Coordinated in the Talairach space
Official websites use .gov
A
.gov website belongs to an official
government organization in the United States.
Secure .gov websites use HTTPS
A lock (
) or https:// means you've safely
connected to the .gov website. Share sensitive
information only on official, secure websites.
Locations of brain areas showing an interval decrease in cerebral glucose metabolism after therapy in patients with a therapeutic response of CR
p < 0.005, uncorrected for multiple comparisons
a Coordinated in the Talairach space