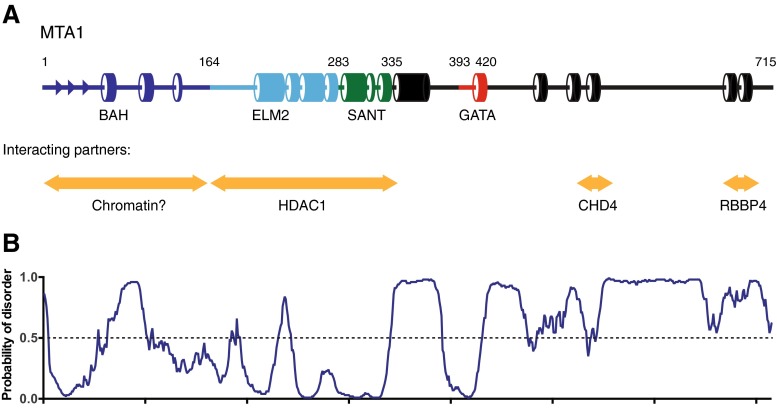
Fig. 1.
The domain structure of MTA1. a Illustration of the secondary structure of MTA1 highlighting the α-helices and β-strands as predicted by PSIPRED [65]. Orange arrows indicate the regions of MTA1 that interact with other binding partners. b Disorder prediction for MTA1. The four characterised domains fall into ordered regions whereas much of the rest of the protein is predicted to be intrinsically disordered (calculated using DISOPRED3 [66]) (colour figure online)

