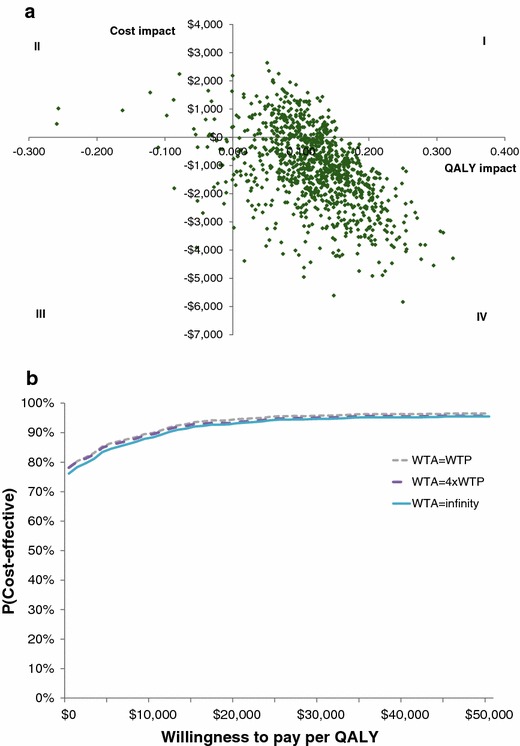
Fig. 4.

Probabilistic sensitivity analyses. a Cost-effectiveness plane. b Probability of cost effectiveness by threshold. 1,000 simulations were performed. WTP willingness to pay per additional QALY gained, QALY quality-adjusted life-year, WTA willingness to accept cost savings per QALY lost
