
Figure 2.
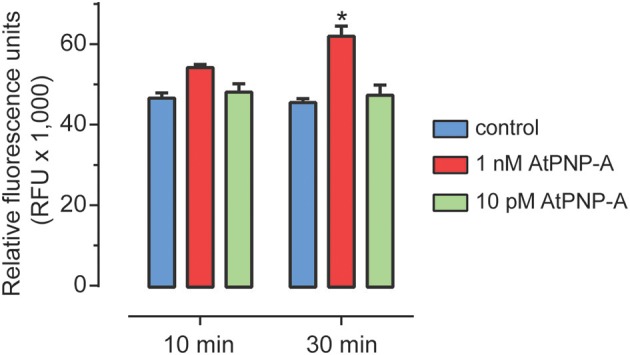
ROS accumulation following AtPNP-A treatment. ROS accumulation after treatment of suspension-cultured cells of A. thaliana (Col-0) with AtPNP-A. Relative fluorescence was measured at 10 and 30 min post-treatment. Data are mean ± s.e.m. of three biological replicates (n = 3). The bar with an asterisk (*) indicates data that is significantly different (p-value < 0.05; Two-Way ANOVA, Tukey post-test).