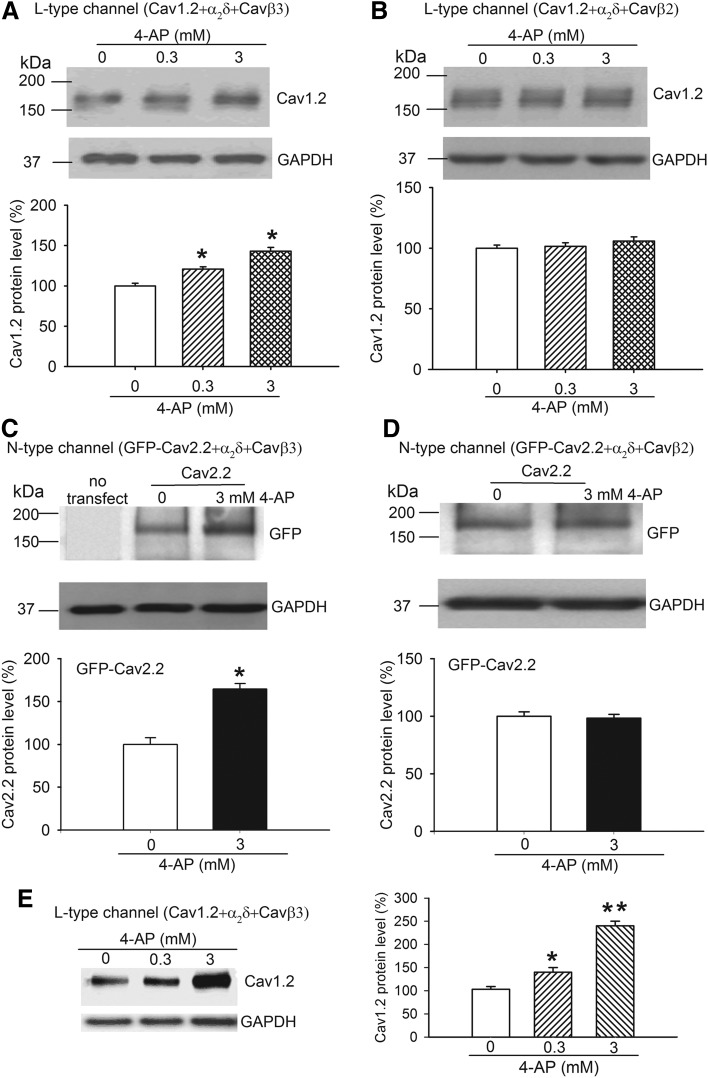
Fig. 5.
4-AP acts through Cavβ3 to increase the plasma membrane expression of Cav1.2 and Cav2.2. (A and B) Original gel images and group data show the differential effect of 0.3 and 3 mM 4-AP on the protein level of Cav1.2 on the plasma membrane in HEK293 cells transfected with α2δ1 and either Cavβ3 (A) or Cavβ2 (B). (C and D) Representative gel images and summary data illustrate the differential effect of 3 mM 4-AP on the protein level of Cav2.2 on the plasma membrane in cells cotransfected with α2δ1 and either Cavβ3 (C) or Cavβ2 (D). N = 4 separate experiments in each group. (E) Original gel image and mean data show the effect of 0.3 and 3 mM 4-AP on the protein level of Cav1.2 on the plasma membrane surface in HEK293 cells cotransfected with α2δ1 and Cavβ3 (N = 5 separate experiments in each group). Data from 4-AP–treated samples were first normalized by using the loading (GAPDH) control and then normalized to the control group (without 4-AP). *P < 0.05, **P < 0.01, compared with the control without 4-AP (paired Student’s t test or repeated measures analysis of variance followed by Dunnett’s post hoc test).

