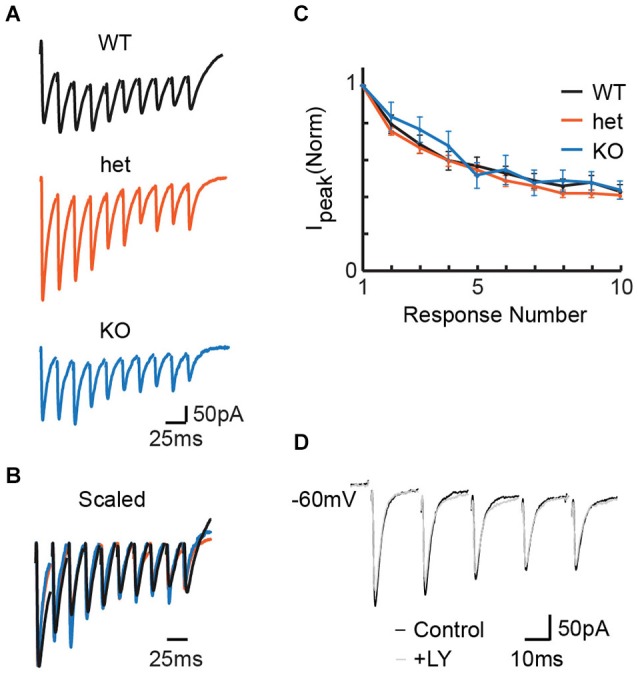
Figure 1.

Stimulation at 50 Hz in the MNTB revealed no effect of genotype on release properties in the LSO. (A) Representative responses to 50 Hz stimulation for WT (P4), het (P5), and KO (P4) tissue. (B) Example traces from (A), scaled for comparison. Traces were first scaled to force all genotypes to have the same value for the amplitude of the first response; then, within each train, the baseline for each response was reset to zero (i.e., baseline for first-response). (C) No differences appeared between WT (n = 20), het (n = 49), and KO (n = 9) mice for paired-pulse ratios (C; p = 0.32, see text). (D) Application of the mGluR antagonist LY 341 495 had no effect on PPR in slices expressing VGLUT3. Example P5 WT slice.
