Figure 2.
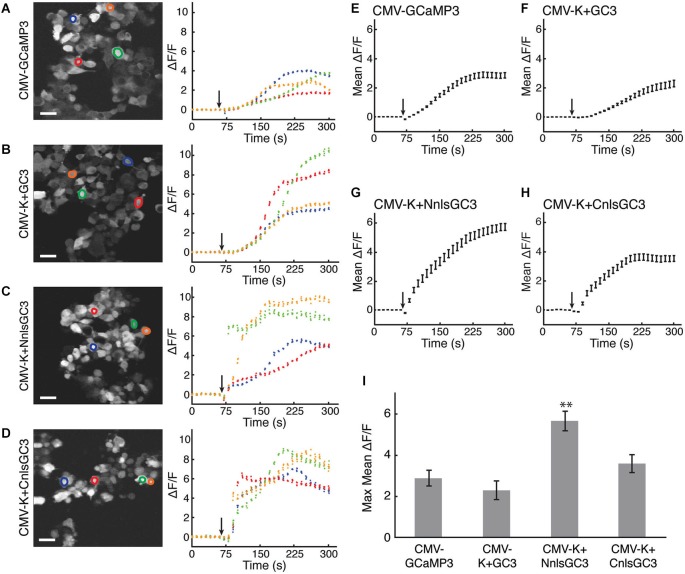
HEK293 cells transfected with CMV-K + NnlsGC3 exhibit the largest fluorescence increase in response to ionomycin. (A–D) 2PLSM fluorescence images (left panels) and fluorescence time series (right panels) for four example cells for each construct. Black arrows indicate when 20 μM ionomycin was added to the well. Scale bars represent 31 μm. (E–H) 2PLSM fluorescence time series averaged across 30 cells for each construct. Black arrows indicate when ionomycin was added to the well. Data points represent mean ± SEM. For clarity, the average of each iteration of four frames was calculated across the cells. (I) The maximum fluorescence increase in response to ionomycin was averaged across 30 cells for each construct. Error bars represent ± SEM. The asterisk indicates significant difference relative to all other measurements (p < 0.01, 2-tailed Student’s T-test).

