Figure 7.
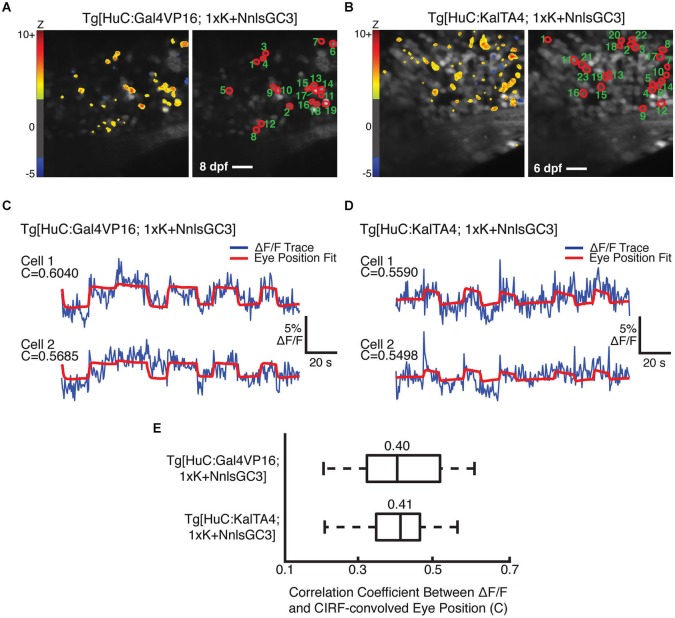
Cells with behaviorally-correlated fluorescence fluctuations in Tg[HuC:Gal4VP16; 1xK + NnlsGC3] and Tg[HuC:KalTA4; 1xK + NnlsGC3]. (A, B) Left panel: Pixel Z scores are mapped onto the mean images of 2PLSM fluorescence time series taken during spontaneous eye movements. Right panel: Cells whose 2PLSM fluorescence fluctuations are positively correlated with CIRF-convolved eye position are circled in red, and numbered in descending order of correlation coefficient, C. Scale bars represent 18 μm. (C, D) Overlaid 2PLSM fluorescence time series (blue) and the scaled CIRF-convolved eye position (red) for the first two cells. The CIRF-convolved eye position is scaled to minimize the squared difference from the fluorescence time series. (E) Summary of correlation coefficients for the identified cells in Tg[HuC:Gal4VP16; 1xK + NnlsGC3] and Tg[HuC:KalTA4; 1xK + NnlsGC3]. Vertical bars within the boxes represent the mean, box edges represent the 25th and 75th quartiles, and whiskers represent minima and maxima.

