
Figure 7.
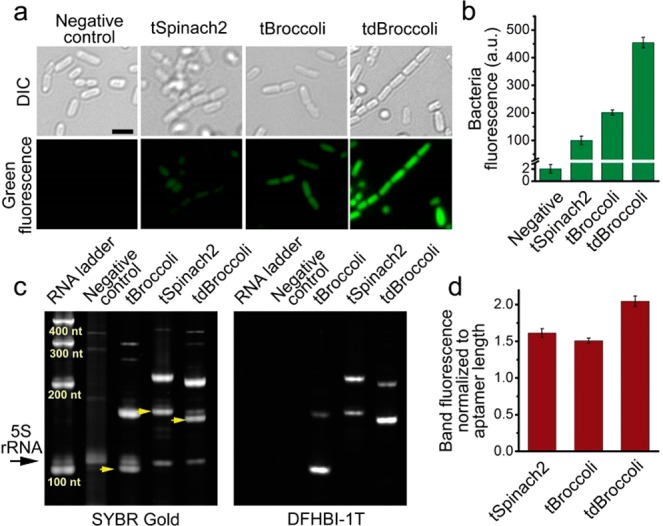
tBroccoli and tdBroccoli show substantially improved performance in bacteria compared to tSpinach2. (a) Microphotographs of bacteria expressing tSpinach2, tBroccoli, and tdBroccoli. Respective aptamers were expressed in E. coli and then bacterial cells were attached to poly d-lysine coated glass-bottom dishes, preincubated with 200 μM DFHBI-1T and imaged under the fluorescent microscope. In these experiments, imaging was performed for 100 ms and the brightness of the images was adjusted on the basis of the high fluorescence signal of tdBroccoli, which results in lower signals for the other aptamers. Cells were imaged in PBS, which lacks magnesium. Here and in other panels, “Negative control” is the empty vector-transformed cells. Scale bar, 2 μm. (b) Quantification of fluorescence signal from bacterial cells in panel a, as measured in suspension on a plate reader. Error bars indicate standard deviations (n = 3). (c) tBroccoli, tSpinach2, and tdBroccoli are expressed at similar levels in bacterial cells. Total RNA from the cells from panels a and b was fractionated on urea-PAGE and stained with DFHBI-1T and SYBR Gold. tBroccoli, tSpinach2 and tdBroccoli RNA bands are indicated with yellow arrows. Higher molecular weight bands are unprocessed transcripts. 5S indicated with the black arrow was used as a loading normalization control. (d) Quantification of the intensity of the SYBR Gold-stained bands from the panel c. Sum of both processed and unprocessed RNA band intensity was normalized to aptamer length. Gel image processing was performed in Image Lab 5.0 software (BioRad). Error bars indicate standard deviations (n = 3).