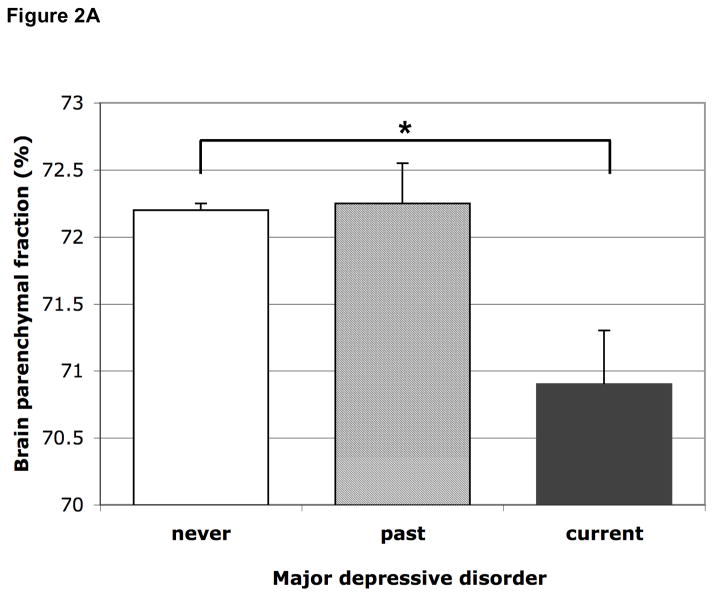
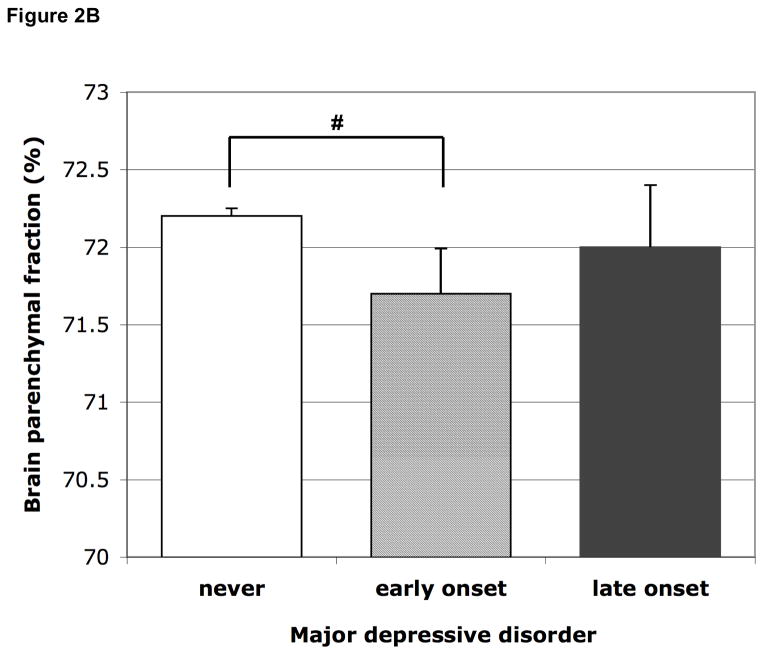
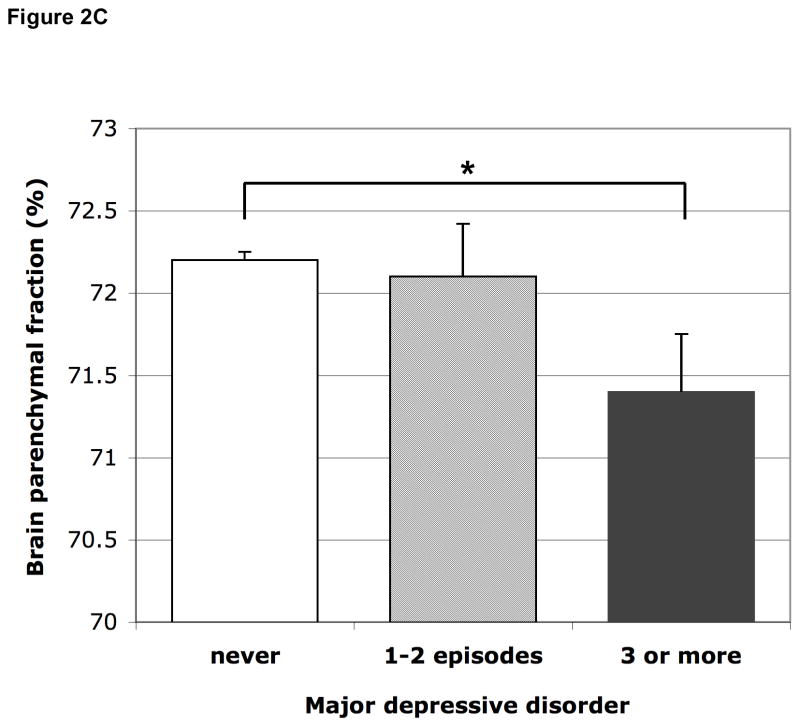
Figure 2.
Figure 2A Mean brain parenchymal fraction according to past and current major depressive disorder. Means are adjusted for age, sex, education, MMSE score, subjective memory complaints, smoking habits, alcohol intake, BMI, systolic and diastolic blood pressure, diabetes, history of stroke, white matter lesion volume and presence of infarcts on MRI. Error bars represent standard errors. * p<0.05
Figure 2B Mean brain parenchymal fraction according to early (first MDD before age 60) and late onset (first MDD at age 60 or older) major depressive disorder. The groups include persons with past as well as current MDD. Means are adjusted for age, sex, education, MMSE score, subjective memory complaints, smoking habits, alcohol intake, BMI, systolic and diastolic blood pressure, diabetes, history of stroke, white matter lesion volume and presence of infarcts on MRI. Error bars represent standard errors. # p=0.095
Figure 2C Mean brain parenchymal fraction according to number of times MDD. Means are adjusted for age, sex, education, MMSE score, subjective memory complaints, smoking habits, alcohol intake, BMI, systolic and diastolic blood pressure, diabetes, history of stroke, white matter lesion volume and presence of infarcts on MRI. Error bars represent standard errors. * p<0.05


