Abstract
Vertical gradients of leaf nitrogen (N) per unit leaf area (NLA) are viewed as plastic responses that optimize N utilization with respect to carbon assimilation. However, it has been shown that plant species, sowing density and N availability affect the steepness of the NLA gradient relative to the photon flux density (PFD) gradient. This paper tests the hypothesis that such variation is related to the N status of the plant. The N status was analysed using the concept of the critical N concentration (Ncrit) in which shoot N per unit dry mass (NSM) decreases with shoot mass, and a negative deviation of actual NSM from Ncrit indicates N shortage in the plant. The hypothesis was tested with contrasting grassland species Medicago sativa, Dactylis glomerata and Taraxacum officinale by varying PFD and N availability, plant density and hierarchical positions of individuals within stands. Combinations of all treatments showed a general negative correlation between the N allocation coefficient (i.e. the slope of the NLA–PFD relationship) and NSM for all three species. Thus, NLA, relative to PFD, gradients became steeper with increasing shoot mass and increasing N shortage in the plant. These data are consistent with the view that internal N availability is an important factor in modifying the NLA gradient.
Key words: Dactylis glomerata, grassland species, light profile, leaf nitrogen distribution, Medicago sativa, plant nitrogen status, size hierarchy, Taraxacum officinale
INTRODUCTION
Vertical gradients of leaf nitrogen (N) are a common feature of plant canopies. The partitioning of leaf N per unit leaf area (NLA) parallels the vertical light distribution within the canopy. NLA profiles are viewed as plastic responses that optimize N utilization with respect to carbon assimilation. Calculated gains in canopy photosynthesis resulting from an optimal, relative to a uniform, N profile range from 24 to 38 % (Hirose and Werger, 1987; Schieving et al., 1992b; Anten et al., 1995). The effects of N supply rate and plant density on leaf N profiles have been investigated for many species. Hirose and Werger (1987) concluded from their model calculations that the relative advantage of optimal NLA distributions over uniform distributions increases with increasing density of the canopy and N availability. A less uniform NLA distribution in dense, relative to open, stands was found in Lysimachia vulgaris (Hirose et al., 1988) and Carex acutiformis (Schieving et al., 1992b). In contrast, density effects on NLA distribution were small in Helianthus annuus (Sadras et al., 1993), Glycine max (Shiraiwa and Sinclair, 1993) and in Triticum aestivum stands (Dreccer et al., 2000). An enhanced N supply led to a steeper NLA gradient in high‐, but not in low‐productivity Carex species (Aerts and De Caluwe, 1994). More uniform NLA distributions with increased N supply were reported by Dreccer et al. (2000) and Milroy et al. (2001) in Gossypium hirsutum stands, whereas variation in N supply rate did not alter the NLA gradient in Glycine max (Shiraiwa and Sinclair, 1993).
These contradictory findings are partly explained by the different models used for analysis of NLA gradients: (a) NLA distribution as a function of the relative leaf area index [ln (NLA/N0) = KF(F/Ft)] and (b) CNLA distribution as a function of the relative irradiance [ln CNLA/N0) = KN ln (I/I0)], where KF and KN are the N allocation coefficients and N0 is the NLA in the uppermost leaf layer (Hirose et al., 1988). When treatment effects on NLA gradients are compared, the conclusions made from the two calculation methods can differ, particularly when plant densities are very different. Thus, NLA distribution was less uniform in dense than in open canopies when NLA was examined relative to F/Ft, but more uniform when NLA was examined relative to I/I0 (Hirose et al., 1988). This is explained by the different ranges of the independent variable in the regression equation. The variable F/Ft always reaches unity, whereas I/I0 depends on the fraction of the light that is absorbed by the canopy.
Nevertheless, part of the variation of the NLA gradients remains to be explained. Hikosaka et al. (1994) induced light gradients along leaves of horizontally growing vine, Ipomoea tricolor. When N supply rates were high, steeper light gradients resulted in steeper gradients of the NLA. Even when the light gradient was inversed so that younger leaves were more shaded than older ones, NLA decreased according to the light gradient. This indicates that the NLA gradient was a response to the light gradient, and the steepness of the light gradient should not affect the slope of the NLA – I/I0 regression. Thus, other factors such as species, leaf age and demand for N may modify the slope of the NLA – I/I0 regression. First, few studies have compared NLA gradients of similarly treated species. Anten et al. (1995) found more uniform N distribution patterns in monocotyledonous compared with dicotyledonous herbs and concluded that the total amount of free N in the canopy determines the pattern of N distribution. Secondly, in erect growing dicotyledonous herbs, leaf age gradient is parallel to light gradient. Mooney et al. (1981) reported a marked decrease in NLA with leaf age in some species, even in leaves not exposed to shading. Hikosaka et al. (1994) found that NLA decreased during the ageing of the leaf when the N supply rate was low, but not with a high N supply. This indicates that demand for N may be an important factor modifying the slope of the NLA – I/I0 regression.
The objective of the present work was to investigate the NLA distribution relative to the light gradient in grassland species. Grassland systems are characterized by diversity of species and individuals in different hierarchical positions exposed to different availabilities of light and N. In such systems, species composition and stand structure may affect the NLA gradient of the individuals. It was hypothesized that the variability of the slope of the NLA – I/I0 regression is related to the N status of the plant. The N status was analysed using the concept of the critical N concentration (Ncrit) in which shoot N per unit dry mass (NSM) decreases with shoot mass, and negative deviation of actual NSM from Ncrit indicates N shortage of the plant (Lemaire and Gastal, 1997). The hypothesis was tested: (a) with contrasting growth forms common in grassland systems (monocotyledonous vs. dicotyledonous species, leaf rosette‐forming vs. erect‐growing plants), and (b) by varying light and N availability, plant density and hierarchical positions of the individuals within stands.
MATERIALS AND METHODS
There were three experiments in controlled conditions. Expts 1 and 2 were carried out in growth rooms (Heraeus Vötsch, Germany) adjusted to: 18/13 °C day/night temperature, 500–600 µmol m–2 s–1 photosynthetic photon flux density (PFD, 400–700 nm) at canopy height, 16‐h photoperiod and 70 % relative humidity. Lighting was supplied by fluorescent tubes and tungsten bulbs, 90 % of the light intensity being provided by the fluorescent tubes. For expt 3, two growth cabinets (E15; Conviron, Winnipeg, Canada) were adjusted to 22/18 °C day/night temperature, 16‐h photoperiod and 75 % relative humidity. Lighting was supplied by fluorescent tubes. Plant materials were non‐nodulated Medicago sativa ‘Planet’, Dactylis glomerata ‘Lidacta’ and wild‐type Taraxacum officinale.
Experiment 1
The aim of the experiment was to investigate the leaf N distribution of individuals growing in different hierarchical positions within plant stands. The grasses Lolium multiflorum, Lolium perenne and Poa pratensis were used to provide tall, intermediate and short background stands, respectively. The target individuals M. sativa, D. glomerata and T. officinale, introduced within these stands, were expected to grow in dominant, intermediate or subordinate positions.
Establishment of background stands: L. multiflorum ‘Ligrande’, L. perenne ‘Liprinta’ and P. pratensis ‘Limousine’ seeds were germinated in seed trays on sand. Three days after germination, seedlings were transplanted into pots (5 cm diameter, 35 cm long) filled with quartz sand (particle size 0·3–0·8 mm). Each pot contained three plants of a single species. Monospecific plant stands were formed by placing the pots into containers (76 cm long, 56 cm wide, 32 cm deep). In order to reduce border effects, curtains of opaque foil were stretched along the edges of the stands. The height of the curtains was adjusted weekly to the mean height of the stand. The stands were placed on trolleys and rearranged weekly within the growth rooms. Twice a day the containers were flooded for 1 h with nutrient solution (2·5 mm KNO3, 2·5 mm Ca(NO3)2, 0·5 mm KH2PO4, 1 mm MgSO4, 0·12 mm Fe as EDTA and micronutrients, pH 6·5). Once a week the pots were flushed with water and the nutrient solution was renewed. The stands grew for 3 weeks, then the plants were clipped to a stubble height of 3 cm.
Addition of target individuals to the background stands: M. sativa, D. glomerata and T. officinale were germinated and potted as described above. There was one plant per pot. Sowing dates were chosen so that target individuals had three leaves when background stands were clipped. After clipping, target individuals were placed into background stands by replacing individual pots of the background stand. Thus, the root medium of the target species was separate and any direct competitive effect on mineral resources between target and background species was avoided. Nine stands were formed with target species combined with each background species. Each stand consisted of 1000 plants m–2 with 100 target individuals. Five weeks after the target individuals had been added to the stands, the light profile was measured and plants were harvested. As the mixed stands with M. sativa and D. glomerata grown in L. perenne tended to lodge shortly before the harvest, no data for these stands are presented.
Experiment 2
Leaf N distribution was investigated in monospecific open and dense stands of M. sativa, D. glomerata and T. officinale. After germination plants were potted and arranged in stands as described above. Nutrient supply was the same as in expt 1. In the open stands each pot contained a single plant, resulting in a density of 400 plants m–2. In the dense stands half of the pots contained a single plant and the other half three plants per pot, resulting in a density of 800 plants m–2. Only single‐potted individuals were used as target individuals. They were harvested 7 weeks after sowing.
Experiment 3
The aim of expt 3 was to investigate the effects of light and N availability on leaf N distribution in M. sativa. Establishment procedures were similar to expt 1. There was one plant per pot. Three weeks after sowing, seedlings were cut to a stubble height of 3 cm. For each treatment 36 plants were placed in a 0·4 m2 stand formed by artificial plants. In order to achieve a vertical light gradient with neutral shading, the artificial plants were made of a green plastic stem and green, opaque plastic leaves arranged in layers at intervals of 10 cm. The stands contained 200 artificial plants m–2 with a light extinction coefficient of 1·1. The leaf area index in each layer was 0·61. A new leaf layer was added to the artificial plants when 50 % of the natural plants overtopped the uppermost artificial leaves by 12 cm. There were five treatments: high PFD and high N supply (I+N+), low PFD and low N supply (I–N–), I+N– and I–N+, respectively. In the fifth treatment, cI–N–, conditions were changed gradually from I+N+ to I–N–. To this end, PFD and N supply were reduced weekly by 25 % from week 4 to week 7. The nutrient solution contained 7·5 mm nitrate‐N (N+) or 1·5 mm nitrate‐N (N–). At the beginning of the experiment lighting in the growth rooms was adjusted to 340 µmol m–2 s–1 PFD (I+) or 85 µmol m–2 s–1 PFD (I–) at pot height. The purpose of the treatments was to simulate growth conditions for dominant plants (I+), subordinate plants (I–) and plants experiencing the transition to a subordinate position (cI–). Four plants per treatment were sampled weekly and 12 plants were sampled for the final harvest 5 weeks after defoliation. By then, relative PFD at pot height was between 0·02 (I+N+) and 0·14 (I–N–).
Light measurement
The distribution of PFD was measured with a photon flux meter (sensor head 12 mm wide, 288 mm long; Solems, Palaiseau, France). PFD was measured at intervals of 2·5 cm (expts 1 and 2) and 10 cm (expt 3) from the ground level to the top of the leaf canopy 1 d before the final sampling and at similar heights in the empty growth rooms after sampling.
Sampling
In expts 1 and 2 target individuals were cut to obtain five horizontal layers. Cutting heights were calculated so that relative canopy light absorption was about 20 % in each layer. Hence, the thickness of the layers varied from 3 to 30 cm. Six target individuals were harvested from each stand. Plants were dissected into leaves, stems with petioles, and inflorescences. The stem of D. glomerata (pseudostem) consisted of leaf sheaths and enclosed young, developing leaf blades. Flowering was not induced and no true stems were found. At the first four harvests of expt 3 plants were cut at ground level and dissected into leaves and stems. At the final harvest, cutting heights were 15 cm in the I+N+ treatment and 10 cm in the other treatments. Plants were dissected into main stem, branches of the main stem and other stems. Each fraction was subdivided as described in expt 1. Leaf area was measured with a planimeter (LI3100; Li‐Cor, Nebraska, USA). Dry mass was determined after oven drying at 70 °C for 72 h. Plant material was ground and total N content of sub‐samples was determined with an NC‐analyser (Carlo Erba 1110, Milan, Italy).
Gas exchange measurements
In expt 3 gas exchange was measured with a portable open gas exchange system (LI6400; Li‐Cor) on attached leaves of the remaining plants 1 d after the final harvest. The middle leaflet of the youngest unfolded leaf on the main stem and every second older leaf were used for measurement. Photosynthetic light response curves were conducted by using a light source (LI6400‐02 LED Source) mounted onto the sensor head. Leaf temperature was kept at 23–24 °C, CO2 pressure in the cuvette was 35 Pa and leaf to air vapour pressure deficit was kept at about 0·9 kPa. Afterwards, the area of the detached leaflets was measured and readings recalculated with the correct leaf area. Dry mass and N content of the leaflets were determined as described above.
Calculations
The extinction coefficient of light was calculated after correction for the light gradient of the growth chambers as
I = I0 exp (–KL F)(1)
where F is the cumulative leaf area index from the top of the canopy and I0 and I are the PFD on a horizontal level above the canopy and within the canopy at depth F; KL is the coefficient of light extinction. Leaf N per unit leaf area (NLA) was related to F (Hirose et al., 1988, Anten et al., 1995) as
NLA = a exp (–KFa F)(2a)
NLA = b exp (–KFb F) + nb(2b)
where a and b + nb are the NLA values at the top of the plant, KFa and KFb are the coefficients of leaf N allocation in respect to cumulative F. In expts 1 and 2, nb was estimated by fitting the measured NLA to eqn (2b). In expt 3, nb was calculated as
Pm = ap (NLA – nb)(3)
where Pm is the light saturated rate of gross photosynthesis and ap and nb are the slope and x intercept of the Pm – NLA relationship. By eliminating F from eqns (1) and (2a, 2b) the relationship between NLA and PFD is formulated as
NLA = a (I/I0)Ka(4a)
NLA = b (I/I0)Kb + nb(4b)
where Ka and Kb are the coefficients of leaf N allocation with respect to the relative PFD, and Ka = KFa/KL and Kb = KFb/KL. An optimal NLA distribution is given when KFa and KFb equal KL, and Ka and Kb approach unity, respectively (Anten et al., 1995). Ka and Kb were calculated after logarithmic transformation: ln (NLA) = ln (a) + Ka ln (I/I0) and ln (NLA – nb) = ln (b) + Kb ln (I/I0).
In expt 3, shoot N per unit shoot dry mass (NSM) of the regrowing M. sativa plants was calculated as a function of shoot dry mass (MS) (Lemaire and Gastal, 1997):
N*SM = c (MS)–d(5)
where N*SM is the estimated NSM at a given shoot mass; c and d are constants. A nitrogen nutrition index for individuals (NNIi) was calculated as:
NNIi = NSM/N*SMN+(6)
where NSM is the actual shoot N concentration of an individual and N*SMN+ the NSM estimated for treatment I+N+ at the same shoot mass. It was assumed that N*SMN+ was close to the critical N concentration (Lemaire and Gastal, 1997) at which plant growth rate is maximal. A value of NNIi higher than or equal to 1 indicates that the individual was in a situation of non‐limiting N supply at the time of sampling. A multiple regression analysis (REG Procedure; SAS Institute, NC, USA) was performed to estimate the contribution of NNIi and NSM to the variation in NLA.
RESULTS
Plant size and shoot N concentration
In expt 1 the mixed stands were dense with leaf area indices of about 16 and 9 in the tall‐ and short‐growing stands, respectively (Table 1). In consequence, at least 96 % of the incident PFD was absorbed by the stands. The tall‐growing grass L. multiflorum formed the highest and P. pratensis the shortest background stands with heights of about 0·8 and 0·3 m, respectively. The target individuals of M. sativa and D. glomerata were in dominant positions in P. pratensis stands, as they overtopped the background stand, but were in intermediate positions in L. multiflorum stands. T. officinale was subordinate in L. multiflorum and intermediate in L. perenne and P. pratensis stands.
Table 1.
Coefficient of light extinction (KL), leaf area index (Ft) of the stand, height of the background stand (h) and mean height of the target individuals Medicago sativa, Dactylis glomerata and Taraxacum officinale relative to the background stand (rel hi) (n = 6, s.e. in parenthesis) in mixed and monospecific dense and open stands (expts 1 and 2)
| Background stand | K L | Ft (m2 m–2) | H (m) | rel hi |
| M. sativa | ||||
| L. m. | 0·372 | 16·3 | 0·80 | 0·76 (0·01) |
| P. p. | 0·398 | 8·7 | 0·30 | 1·48 (0·11) |
| Dense | 0·644 | 7·4 | 0·57 | 1 |
| Open | 0·675 | 5·4 | 0·51 | 1 |
| D. glomerata | ||||
| L. m. | 0·352 | 16·5 | 0·80 | 0·89 (0·08) |
| P. p. | 0·371 | 9·5 | 0·23 | 1·64 (0·05) |
| Dense | 0·408 | 8·9 | 0·60 | 1 |
| Open | 0·432 | 7·3 | 0·55 | 1 |
| T. officinale | ||||
| L. m. | 0·332 | 16·7 | 0·73 | 0·56 (0·01) |
| L. p. | 0·309 | 16·0 | 0·44 | 0·83 (0·02) |
| P. p. | 0·386 | 8·7 | 0·30 | 0·84 (0·03) |
| Dense | 0·318 | 13·8 | 0·43 | 1 |
| Open | 0·361 | 9·6 | 0·29 | 1 |
L. m., Lolium multiflorum; L. p., Lolium perenne; P. p., Poa pratensis.
The coefficient of light extinction (KL) of the canopy was highest in the monospecific stands of M. sativa and lower in D. glomerata and T. officinale. In the mixed stands the effect of the target species on KL was rather small, and KL was comparable with values of pure grass stands (Table 1). In expt 3, KL of the artificial stands with introduced M. sativa was 0·91.
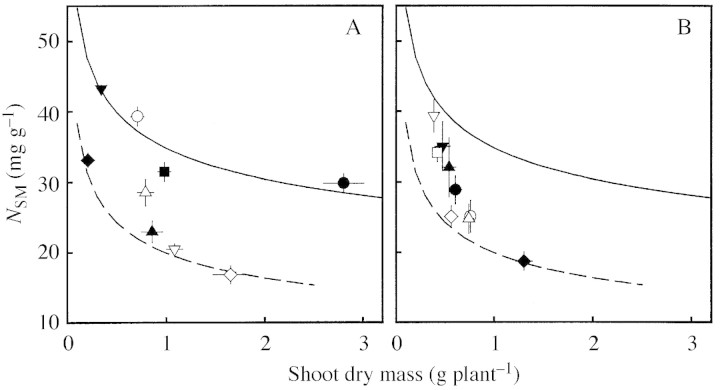
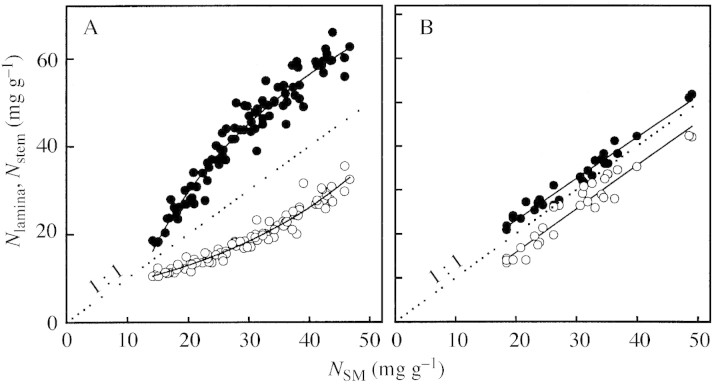
Shoot N per unit mass (NSM) decreased during the regrowth with increasing plant size (Fig. 1). This decline was mainly due to a strong decrease in the N concentration of the stems (Nstem = 23·0 MS–0·284, r2 = 0·86 and Nlamina = 48·5 MS–0·095, r2 = 0·28 for the I+N+ treatment) and a decrease in the leaf : stem mass ratio (data not shown). Compared with the M. sativa plants of the I+N+ treatment, low N supply (I+N–) reduced NSM significantly at comparable shoot mass. In contrast, low PFD did not affect NSM, i.e. NSM was the same for the high and low PFD treatments at comparable shoot mass and corresponding rates of N supply. Consequently, after 5 weeks of regrowth, individuals from the I+N+, cI–N– and I–N– treatments showed very similar NSM, although they differed considerably in shoot mass. In expts 1 and 2, rates of N supply were the same as in the I+N+ treatment of expt 3. Nevertheless, NSM was in general lower than expected from the N*SMN+–MS relationship of the I+N+ treatment, indicating that rates of N supply in expts 1 and 2 were not optimal. For D. glomerata and T. officinale, treatments induced a steep decline in NSM with increasing shoot mass. Target species grown in P. pratensis stands showed the highest, and those grown in L. multiflorum stands the lowest, deviation from the N*SMN+ of M. sativa.
Fig. 1. Shoot N per unit dry mass (NSM) in relation to shoot dry mass (MS) of individuals. Lines denote N*SM during a 5‐week regrowth period for Medicago sativa: plants grown with high PFD/high N supply (I+N+, solid line, N*SMN+ = 34·8 MS–0·196, r2 = 0·73, n = 24) or high PFD/low N supply (I+N–, dashed line, N*SMN‐ = 19·9 MS–0·285, r2 = 0·73, n = 24). Symbols denote NSM (mean ± s.e.) of individuals after 5 weeks regrowth. A, M. sativa grown with high PFD and high N supply (I+N+, filled circles), high PFD and low N supply (I+N–, filled upright triangles), low PFD and high N supply (I–N+, filled inverted triangles), low PFD and low N supply (I–N–, filled diamonds), in conditions changing from high to low PFD and N supply (cI–N–, filled squares) (expt 3, n = 12), grown in dense (open circles) and open (open upright triangles) monocultures and in Lolium multiflorum (open inverted triangles) and Poa pratensis (open diamonds) stands (n = 6). B, Dactylis glomerata (filled symbols) and Taraxacum officinale (open symbols) grown in dense (circles) and open (upright triangles) monocultures and in L. multiflorum (inverted triangles), Lolium perenne (open squares) and P. pratensis (diamonds) stands (n = 6).
N concentration was higher in the leaf lamina (Nlamina) than in the stem (Nstem) fraction (Fig. 2). In D. glomerata, N concentration of both organs decreased linearly with NSM. In M. sativa, the decline was steeper for Nlamina than for Nstem. Nlamina and Nstem declined with decreasing NSM towards 10 and 6 mg N g–1 DM, respectively.
Fig. 2. N per unit dry mass of leaf lamina (filled circles) and stem (open circles) in relation to shoot N per unit dry mass (NSM) of Medicago sativa (A) and Dactylis glomerata (B) individuals.
Evaluation of nb
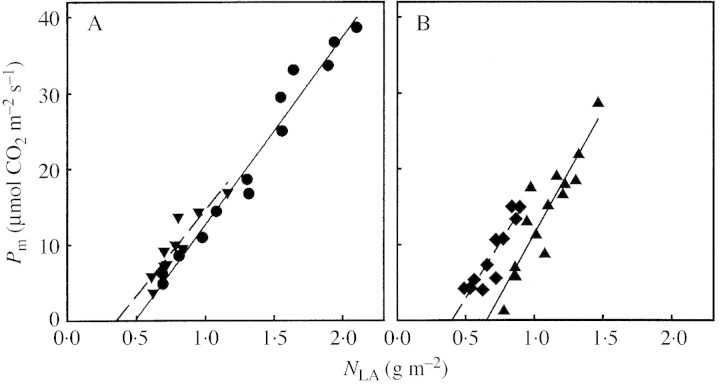
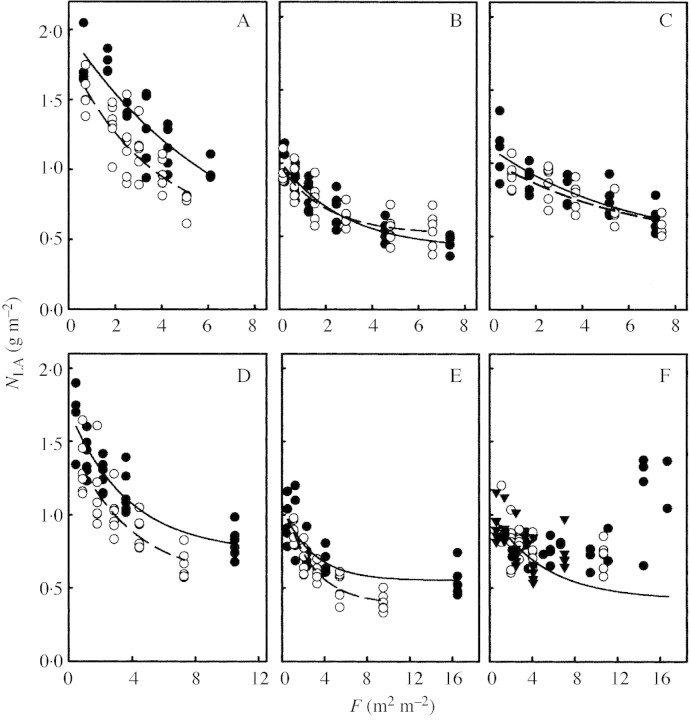
Light saturated rate of gross photosynthesis (Pm) increased linearly with NLA (Fig. 3). The intercept with the x‐axis (nb, Pm = 0) was highest for the I+N– and lowest for the I–N+ treatment. The high nb in the I+N– treatment was reflected in the highest mass per unit leaf area (40 g m–2) and the lowest N content per unit mass (16·3 mg N g–1) in the lowest positioned leaves within the canopy. The opposite was found for the leaves of the I–N+ treatment (14·3 g m–2, 24·7 mg N g–1), whereas the values for the leaves of the other treatments were intermediate (data not shown). For expts 1 and 2, nb was calculated using the NLA–F relationship (Fig. 4; Table 2). No significant nb was found for M. sativa grown in dense monoculture. In expt 2, T. officinale showed increasing NLA in the lowest layers of the canopy. Thus, for the calculation of nb the lowest layer was excluded and data from all treatments were pooled.
Fig. 3. Light saturated gross photosynthesis (Pm) as a function of leaf N per unit leaf area (NLA) for Medicago sativa leaves. Plants grown with high/low incident PFD (I+/I–) and high/low N supply N+/N–): A, I+N+ (circles), I–N+ (inverted triangles); B, I+N– (upright triangles), I–N– (diamonds). Regression lines (eqn 3): I+N+, Pm = 24·8 (NLA – 0·49), r2 = 0·97; I–N+, Pm = 22·5 (NLA – 0·36), r2 = 0·84; I+N–, Pm = 32·7 (NLA – 0·65), r2 = 0·82; I–N–, Pm = 29·1 (NLA – 0·40), r2 = 0·84.
Fig. 4. Leaf N per unit leaf area (NLA) in relation to the cumulative leaf area index (F) for Medicago sativa (A and D), Dactylis glomerata (B and E) and Taraxacum officinale (C and F). Plants grown in dense (filled circles) and open (open circles) monocultures (A–C), and in Lolium multiflorum (filled circles), Poa pratensis (open circles) and Lolium perenne (filled inverted triangles) stands (D–F).
Table 2.
Parameter nb (g m–2) of the relationship between leaf N per unit leaf area (NLA) and relative incident PFD (I/I0) for Medicago sativa, Dactylis glomerata and Taraxacum officinale individuals grown in monospecific dense and open stands and in Lolium multiflorum, Lolium perenne and Poa pratensis grass stands
| n b | |||||
| Species | Dense | Open | L. m. | L. p. | P. p. |
| M. s. | 0·25 (n. s.) | 0·55 (0·08) | 0·75 (0·04) | 0·56 (0·22) | |
| D. g. | 0·42 (0·06) | 0·52 (0·05) | 0·55 (0·06) | 0·39 (0·05) | |
| T. o. | 0·42 (0·22) | 0·42 (0·22) | 0·42 (0·22) | 0·42 (0·22) | 0·42 (0·22) |
Regression models (eqn 2b): NLA = b exp(–KFb F) + nb.
Mean and s.e. in parenthesis.
Coefficient of N allocation
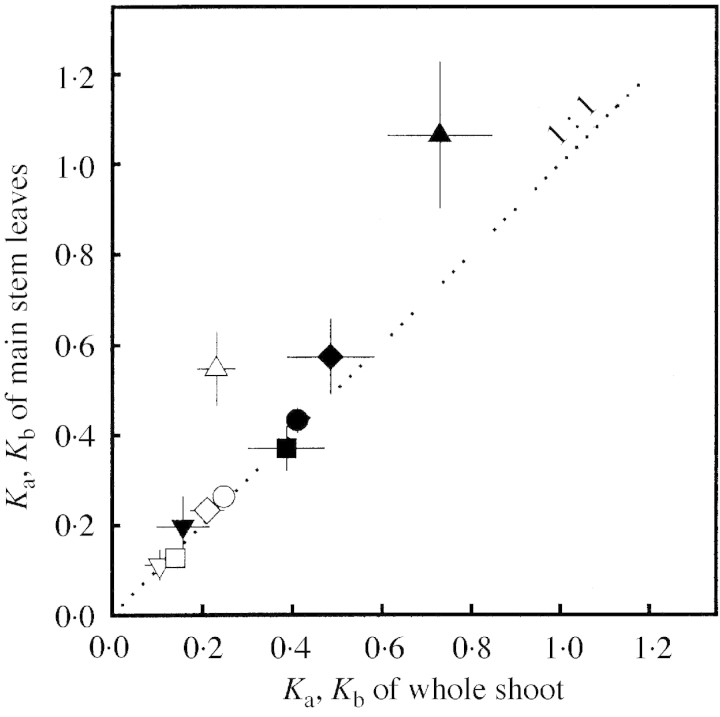
The mean coefficient of determination (r2) of the NLA– (I/I0) regression varied among treatments from 0·59 (I+N–) to 0·99 (M. sativa in L. multiflorum stand). Variation of Ka and Kb within treatments was due to individuals which showed decreasing NLA in the uppermost canopy layer (13 % for D. glomerata and 20 % for T. officinale) and increasing NLA in the lowest layer (30 % D. glomerata., 18 % M. sativa, 87 % T. officinale). Furthermore, Ka and Kb were influenced by the branching status of the M. sativa plants. In expt 3, Ka and Kb of the main stem leaves and of the whole shoot of M. sativa were analysed. In plants with low N supply (I+N–, I–N–), Ka and especially Kb, tended to be higher for main stem leaves than for the whole shoot (Fig. 5).
Fig. 5. Coefficient of leaf N allocation (Ka and Kb) for main stem leaves in relation to Ka and Kb of whole shoots (mean ± s.e.). Open symbols with Ka (NLA = a (I/I0)Ka) and closed symbols with Kb (NLA = b (I/I0)Kb + nb). I+N+ (circles), I+N– (upright triangles), I–N+ (inverted triangles), I–N– (diamonds), and cI–N– (squares).
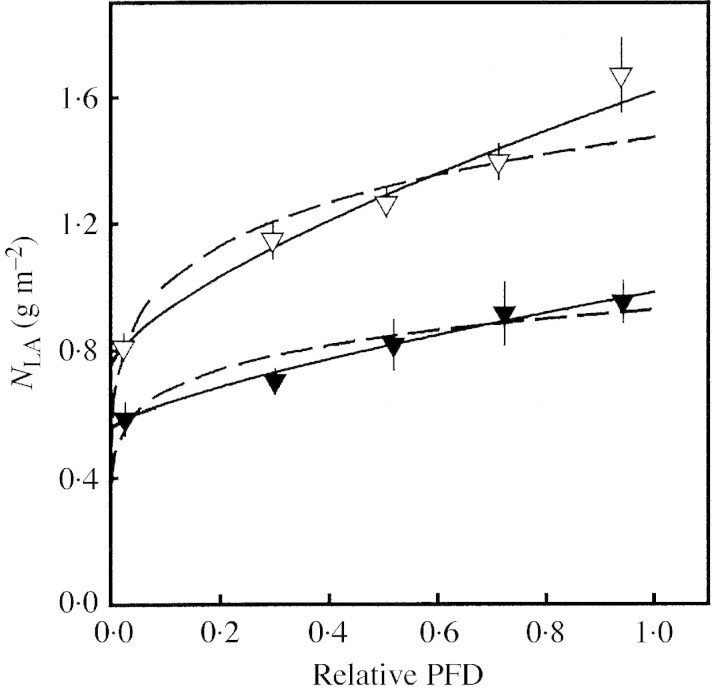
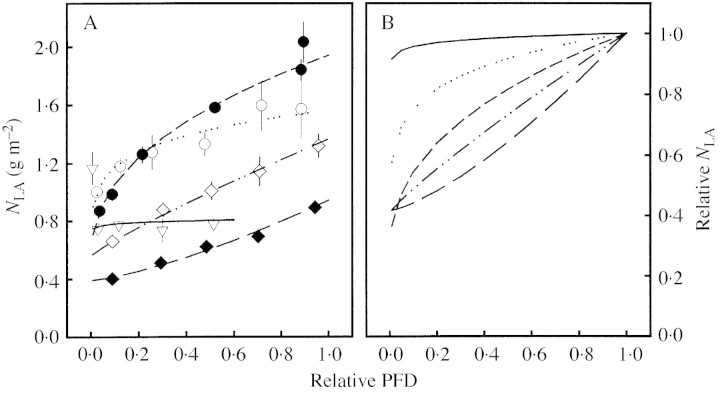
In general, introducing the parameter nb into the NLA– (I/I0) relationship (eqn 4b) improved the goodness‐of‐fit as shown, for example, in Fig. 6. Thus, in the following, results from eqn 4b only are presented. Figure 7 shows a range of treatments that induced increasing values of Kb from 0·04 to 1·37. Although NLA decreased in many treatments by about 50 % from the top to the bottom leaves (e.g. I+N+, M. sativa and D. glomerata in P. pratensis, Fig. 7), Kb varied among these treatments. A moderate Kb was manifested by a slow decrease of the NLA in the upper leaf layers followed by a rapid decrease in the lower layers. High Kb values were found when NLA decreased linearly or even exponentially with PFD. Thus, at a 50 % reduction of the relative PFD, plants with moderate Kb (e.g. I+N+) showed up to 20 % higher relative NLA than plants with high Kb, although the overall decrease in NLA was similar (Fig. 7B).
Fig. 6. Leaf N per unit leaf area (NLA) as a function of relative PFD (I/I0) of Medicago sativa (open triangles) and Dactylis glomerata (filled triangles) grown in Lolium multiflorum stands (mean ± s.e., n = 6). Regressions were analysed for each individual. Solid regression line for M. s.: NLA = 0·87 (±0·10) (I/I0)0·69 (±0·06) + 0·75 (±0·04), r2 = 0·99 (±0·005) and D. g.: NLA = 0·43 (±0·07) (I/I0)0·74 (±0·20) + 0·55 (±0·06), r2 = 0·80 (±0·09). Dashed regression line for M. s.: NLA = 1·47 (±0·07) (I/I0)0·16 (±0·02), r2 = 0·84 (±0·03) and D. g.: NLA = 0·93 (±0·06) (I/I0)0·14 (±0·008), r2 = 0·75 (±0·08).
Fig. 7. A, Leaf N per unit leaf area (NLA) (mean ± s.e.) and B, relative NLA as a function of relative PFD (I/I0) for selected treatments with increasing coefficient of leaf N allocation (Kb). Taraxacum officinale grown in a Lolium multiflorum stand (open triangles, solid line, Kb = 0·04), Medicago sativa grown in dense monoculture (open circles, dotted line, Kb = 0·15), grown with high PFD and high N supply (filled circles, short dashed line; Kb = 0·41), grown in a Poa pratensis stand (open diamonds, dashed‐dotted line, Kb = 0·87), and Dactylis glomerata grown in a P. pratensis stand (filled diamonds, long dashed line, Kb = 1·37). Regression model: NLA = b (I/I0)Kb + nb.
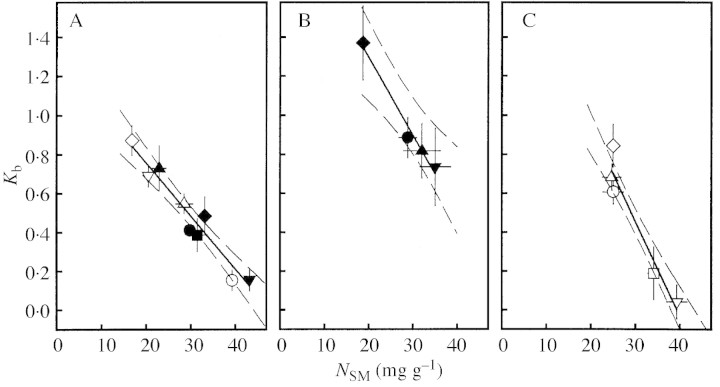
In general, Kb was negatively correlated with N content per unit shoot mass (NSM), i.e. leaf N allocation was more uniform in treatments which induced high NSM (Fig. 8). Similar results were found when Kb was set in relation to Nlamina and Nstem, respectively (data not shown). At compar able NSM, Kb was significantly higher in D. glomerata than in M. sativa, whereas T. officinale showed rather lower Kb than M. sativa when NSM was high.
Fig. 8. Coefficient of leaf N allocation (Kb) in relation to shoot N per unit mass (NSM) for A, Medicago sativa, B, Dactylis glomerata and C, Taraxacum officinale individuals (mean ± s.e.). For explanation of symbols see Fig. 1. Regression lines for means of treatments in A, Kb = –0·028 NSM + 1·32, r2 = 0·94, in B, Kb = –0·040 NSM + 2·09, r2 = 0·98, and in C, Kb = –0·049 NSM + 1·92, r2 = 0·92. Dashed lines, 95 % confidence interval for individual plants.
NSM declined with increasing shoot mass and decreasing NNIi. Multi‐regression analysis using the means of the treatments showed, for M. sativa, that 85 % of the variation in Kb was explained by the variation of NNIi and 12 % by variation of shoot mass (Table 3). Multi‐regression analysis of individuals revealed a high variation within treatments, and contributions of NNIi and shoot mass to the variation of NLA were 37 and 10 %, respectively. For D. glomerata and T. officinale no significant contribution of shoot mass to the variation of Kb was found (data not shown).
Table 3.
Summary of regression analyses among N nutrition index (NNIi), shoot dry mass (MS) and coefficient of N allocation (Kb) for Medicago sativa
| Parameter | Value | s.e. | SS | F |
| c 1 | 1·311 | 0·070 | 0·775 | 351·4*** |
| c 2 | –1·152 | 0·083 | 0·426 | 193·2*** |
| c 3 | 0·109 | 0·021 | 0·057 | 25·8** |
| Stepwise selection | ||||
| Variable entered | No. of variables | Partial r2 | Model r2 | F |
| NNIi | 1 | 0·851 | 0·851 | 39·8*** |
| M S | 2 | 0·121 | 0·972 | 25·8** |
Model: Kb = c1 + c2 NNIi + c3 MS.
** P < 0·01; *** P < 0·001.
DISCUSSION
In the present study the gradient of leaf N per unit area (NLA) relative to PFD gradient was analysed for grassland species grown in different combinations of PFD and N availability. As a measure for the NLA gradient, coefficients of N allocation, as the slope of the linear relationship between ln (NLA) and ln (I/I0), were calculated. Introducing a minimal NLA (nb in eqn 4b) into the NLA – (I/I0) relationship improved the accuracy of the estimated coefficient of N allocation (Kb) (Fig. 6). That is, above a minimal NLA, NLA distribution relative to the PFD gradient was often better explained by a more linear or even positive curvilinear pattern (Fig. 7). Estimates of nb using eqn 2b in expts 1 and 2 and the x intercept of the Pm–NLA regression in expt 1 resulted in similar values for M. sativa. As nb was positively correlated with leaf mass per unit leaf area, high nb values in the lowest leaves indicated low N per unit leaf mass. The nb values (g m–2) used in the present study were comparable with those of other plants: 0·36, Oryza sativa; 0·41, Glycine max; 0·18, Sorghum bicolor; 0·35, Amaranthus cruentus (Anten et al., 1995); 0·50 and 0·48 for dominant and subordinate Amaranthus dubius (Anten and Werger, 1996); 0·28, Xanthium canadense (Hikosaka et al., 1999) and 0·77, Carex acutiformis (Schieving et al., 1992b). The nb values were comparable with NLA values for dead leaves with about 0·45 for Medicago sativa (Lemaire et al., 1991) and Solidago altissima (Hirose and Werger, 1987) and 0·28 for Carex acutiformis (Hirose et al., 1989). Thus, nb values reflect structural N which cannot be remobilized.
Regarding means of treatments, NLA was reduced by 45 % (s.e. = 2·2, n = 14) from the top to the bottom leaves in treatments which induced steep NLA gradients (Kb > 0·3) and by 21 % (10·4, n = 4) in treatments with more uniform NLA distributions. However, despite a very similar overall decline in NLA in many treatments, NLA distribution relative to the PFD gradient altered with increasing NSM from negatively to positively curvilinear. This indicates that, within a given relative decline of NLA from the top to the bottom leaves, adaptation of NLA to the PFD gradient depended on the N status of the plant, i.e. the internal N availability. Interestingly, due to the negatively curvilinear decline NLA was mainly higher in the middle layers of the canopy where the probability of sunflecks might be high.
A linear decline in NLA with PFD (Kb ≈ 1) appeared only in treatments which induced low NSM; most treatments showed Kb <1. A more uniform, relative to the optimal, distribution has been found in many studies (Hirose and Werger, 1987; Schieving et al., 1992a, b; Anten et al., 1995; Rousseaux et al., 1999). The PFD gradient reflects the average PFD with increasing depth in the canopy. However, a leaf may experience higher than average PFD due to sunflecks and heliotropic movement (Rousseaux et al., 1999). With higher NLA the above‐average PFD can be used to increase photosynthesis (Leuning et al., 1995). Thus, high NLA in the middle of the canopy would increase the photochemical efficiency of plants. When internal availability of N becomes scarce (lower NSM), this extra N in middle leaves may be utilized to support the growth of upper leaves, thus decreasing NLA linearly or even more steeply with the PFD gradient.
Variation of NLA distribution within treatments
Variation of NLA distribution within treatments was partly attributable to the branching status of the individuals and leaf senescence. In erect‐growing dicots, leaves are placed in different positions of the canopy and leaf senescence on the main axis occurs along the light gradient, promoting a steep vertical NLA gradient. However, in M. sativa, senescent leaves of the main axis were replaced by younger leaves on branches. This was obvious in treatments with low N supply (I+N–, I–N–), where NLA gradients were steeper in leaves of the main stem compared with the gradient of the whole shoot (Fig. 5). The increase in NLA in the lowest layer of the canopy found in many D. glomerata and T. officinale plants might be related to developing tillers or leaves on the main axis, respectively. A further factor contributing to the variation of the NLA gradient within treatments was the decline of NLA in the top layer in some individuals of D. glomerata and T. officinale. This might indicate the beginning of senescence in the leaf tips of these species resulting in a more uniform NLA distribution. Besides these factors inducing variation of the NLA gradient within treatments, shoot size and N nutrition status of the plant strongly affected the steepness of the NLA gradient.
Effect of plant size and N nutrition status on NLA distribution
The coefficient of leaf N allocation Kb was negatively correlated with shoot N per unit mass (NSM). There are two factors affecting NSM: plant size and N nutrition status. In general, NSM declines with increasing shoot mass (MS) (Lemaire and Gastal, 1997). This decline is mainly due to a decrease in Nstem, and a decrease in the leaf : stem ratio; i.e. NSM declines with increasing proportion of structural tissues. In the present study, the slope of the relationship between ln (NSM) and ln (MS) was –0·196 for plants grown with high PFD and high N supply (Fig. 1). This value is very similar to that of dominant plants of a sweet sorghum stand in which rates of N supply resulted in maximal growth rate of the stand, and where NSM of the stand was equal to the critical N concentration (Lemaire and Gastal, 1997). Thus, N concentration in plants of the I+N+ treatment (N*SMN+) seemed to be close to the critical N concentration where additional N supply would not result in extra growth. A negative deviation from N*SMN+, reflected by a low N nutrition index (NNIi < 1), would indicate a shortage of N. In expt 3, low NNIi was induced by low rates of N supply (I+N–, I–N–, cI–N–). In expt 1 and 2 increasing shoot mass was accompanied by decreasing NNIi. In these experiments plant density was much higher than in expt 3. Thus, the rate of N supply may have been suboptimal. Whatever the cause, in all three species, NLA gradient was affected by NSM in that it increased with increasing shoot mass and with increasing deviation of the NSM from the critical N concentration of shoots. Kb was higher in D. glomerata than in M. sativa and T. officinale at the whole shoot level (Fig. 8). However, Kb values for main stem leaves of M. sativa were higher and closer to the values of D. glomerata in plants with low NNIi. In contrast, Anten et al. (1995) reported less uniform NLA distribution in dicots than in monocots.
The correlation between NLA gradient and NSM suggests a general explanation for the variation of NLA due to variation in N fertilization rate, plant density, plant size and the hierarchical position of individuals within the canopy. First, when compared with high N supply, low N supply resulted in reduced NSM and steeper NLA gradients in both high and low PFD treatments. In agreement with the present results, Dreccer et al. (2000) found that a steeper NLA gradient at low N supply in wheat narrowed the gap in maximum canopy photosynthesis compared with the high N treatment, particularly at high PFD. Compared with high N supply, a steeper NLA gradient was found at low N supply in cotton (Milroy et al., 2001). Leuning et al. (1995) showed that, at low N supply, a less uniform, compared with a uniform, NLA distribution increased simulated canopy photosynthesis significantly, whereas gains were negligible at high N. When site fertility was manipulated by mowing, the mown and nutrient‐depleted site produced Solidago altissima stands with a less uniform NLA distribution compared with the non‐mown stands (Egli and Schmid, 2000).
Secondly, an effect of plant density on NLA distribution was found for M. sativa. NSM was higher and NLA more uniformly distributed in dense stands (Fig. 8). This relationship was also found in Lysimachia vulgaris stands where plant density increased NSM and decreased the coefficient of N allocation (Hirose et al., 1988). However, when plant density did not affect NSM, as for D. glomerata and T. officinale, NLA gradients were similar in open and dense stands. Small effects of plant density on the NLA gradient were also observed by Dreccer et al. (2000), Del Pozo and Dennett (1999), Sadras et al. (1993) and Shiraiwa and Sinclair (1993).
Thirdly, as increasing shoot mass results in decreasing NSM, the NLA gradient should also increase with plant growth. In treatments resulting in similar NNIi (≈ 1·0 for I+N+, I–N+ and M. sativa grown in dense monoculture, Fig. 1), NSM decreased and Kb increased with shoot mass. In a Carex acutiformis stand NSM declined and the NLA gradient became steeper during a growth period (Hirose et al., 1989).
Fourthly, delayed germination, slow regrowth and low N availability are factors which result in plants being located at subordinate positions within the canopy. Once shaded, growth rate is further slowed and plant size reduced relative to dominant plants. Realised NSM depends on shoot size and N availability, which affect NSM in opposite directions. Thus, analysis of the NLA gradient in individuals from differential hierarchical positions should take into account shoot size and nutrient status. For plants with similar NNIi, NSM decreased and Kb increased from subordinate to dominant plants due to the increasing shoot mass (I–N+ vs. I+N+, I–N– vs. I+N–, M. sativa grown in L. multiflorum vs. P. pratensis). In an Amaranthus dubius stand, in which dominant plants showed lower NSM and Nlamina than subordinate plants, the NLA gradient was steeper for dominant than for subordinate plants (Anten et al., 1996). In comparison, reduced availability of both PFD and N (I–N– and cI–N– vs. I+N+) reduced NNIi and shoot mass, resulting in similar NSM and Kb values for dominant and subordinate individuals. Anten et al. (1998) found the steepest NLA gradients among the most subordinate plants of a Xanthium canadense stand. However, all size classes showed similar Nlamina which could be interpreted as increasing N shortage (decreasing NNIi) towards the smallest, most subordinate plants inducing steep NLA gradients.
CONCLUSIONS
The general result of the correlation between Kb and NSM explains the variation in the NLA gradients for a broad selection of plant growth conditions, including temporary and spatial heterogeneity of resource availability below and above ground. NSM reflects the relationship between the cumulative net assimilation of N and C. NSM decreases with increasing shoot mass and is related to the time‐integrated competition for N and PFD among plants. Thus, the present data indicate that the NLA gradient is not only a result of the light climate and leaf age but is an integrated result of plant size and availability of above‐ and below‐ground resources.
ACKNOWLEDGEMENTS
We thank Dr G. Lemaire and an anonymous referee for helpful comments on an earlier version of the manuscript. The work was supported by the Federal Ministry of Research and Technology (BMBF 0339370) and by the Deutsche Forschungsgemeinschaft (SFB 607).
Supplementary Material
Received: 2 July 2003;; Returned for revision: 11 July 2003. Accepted: 28 July 2003; Published electronically: 10 September 2003
References
- AertsR, De Caluwe H.1994. Effects of nitrogen supply on canopy structure and leaf nitrogen distribution in Carex species. Ecology 75: 1482–1490. [Google Scholar]
- AntenNPR, Werger MJA.1996. Canopy structure and nitrogen distribution in dominant and subordinate plants in a dense stand of Amaranthus dubius L. with a size hierarchy of individuals. Oecologia 105: 30–37. [DOI] [PubMed] [Google Scholar]
- AntenNPR, Miyazawa K, Hikosaka K, Nagashima H, Hirose T.1998. Leaf nitrogen distribution in relation to leaf age and photon flux density in dominant and subordinate plants in dense stands of a dicotyledonous herb. Oecologia 113: 314–324. [DOI] [PubMed] [Google Scholar]
- AntenNPR, Schieving F, Werger MJA.1995. Patterns of light and nitrogen distribution in relation to whole canopy carbon gain in C3 and C4 mono‐ and dicotyledonous species. Oecologia 101: 504–513. [DOI] [PubMed] [Google Scholar]
- DelPozoA, Dennett MD.1999. Analysis of the distribution of light, leaf nitrogen, and photosynthesis within the canopy of Vicia faba L. at two contrasting plant densities. Australian Journal of Agricultural Research 50: 183–189. [Google Scholar]
- DreccerMF, Van Oijen M, Schapendonk AHCM, Pot CS, Rabbinge R.2000. Dynamics of vertical leaf nitrogen distribution in a vegetative wheat canopy. Impact on canopy photosynthesis. Annals of Botany 86: 821–831. [Google Scholar]
- EgliP, Schmid B.2000. Seasonal dynamics of biomass and nitrogen in canopies of Solidago altissima and effects of a yearly mowing treatment. Acta Oecologica 21: 63–77. [Google Scholar]
- HikosakaK, Sudoh S, Hirose T.1999. Light acquisition and use by individuals competing in a dense stand of an annual herb, Xanthium canadense Oecologia 118: 388–396. [DOI] [PubMed] [Google Scholar]
- HikosakaK, Terashima I, Katoh S.1994. Effects of leaf age, nitrogen nutrition and photon flux density on the distribution of nitrogen among leaves of a vine (Ipomoea tricolor Cav.) grown horizontally to avoid mutual shading of leaves. Oecologia 97: 451–457. [DOI] [PubMed] [Google Scholar]
- HiroseT, Werger MJA.1987. Maximizing daily canopy photosynthesis with respect to the leaf nitrogen allocation pattern in the canopy. Oecologia 72: 520–526. [DOI] [PubMed] [Google Scholar]
- HiroseT, Werger MJA, Pons TL, van Rheenen JWA.1988. Canopy structure and leaf nitrogen distribution in a stand of Lysimachia vulgaris L. as influenced by stand density. Oecologia 77: 145–150. [DOI] [PubMed] [Google Scholar]
- HiroseT, Werger MJA, van Rheenen JWA.1989. Canopy development and leaf nitrogen distribution in a stand of Carex acutiformis Ecology 70: 1610–1618. [Google Scholar]
- LemaireG, Gastal F.1997. N uptake and distribution in plant canopies. In: Lemaire G, ed. Diagnosis of the nitrogen status in crops Berlin, Heidelberg: Springer‐Verlag, 3–43. [Google Scholar]
- LemaireG, Onillon B, Gosse G, Chartier M,Allirand JM.1991. Nitrogen distribution within a lucerne canopy during regrowth: relation with light distribution. Annals of Botany 68: 483–488. [Google Scholar]
- LeuningR, Kelliher FM, De Pury DGG, Schulze E‐D.1995. Leaf nitrogen, photosynthesis, conductance and transpiration: scaling from leaves to canopies. Plant, Cell and Environment 18: 1183–1200. [Google Scholar]
- MilroySP, Bange MP, Sadras VO.2001. Profiles of leaf nitrogen and light in reproductive canopies of cotton (Gossypium hirsutum). Annals of Botany 87: 325–333. [Google Scholar]
- MooneyHA, Field C, Gulmon SL, Bazzaz FA.1981. Photosynthetic capacity in relation to leaf position in desert versus old‐field annuals. Oecologia 50: 109–112. [DOI] [PubMed] [Google Scholar]
- RousseauxMC, Hall AJ, Sánchez RA.1999. Light environment, nitrogen content, and carbon balance of basal leaves of sunflower canopies. Crop Science 39: 1093–1100. [Google Scholar]
- SadrasVO, Hall AJ, Connor DJ.1993. Light‐associated nitrogen distribution profile in flowering canopies of sunflower (Helianthus annuus L.) altered during grain growth. Oecologia 95: 488–494. [DOI] [PubMed] [Google Scholar]
- SchievingF, Werger MJA, Hirose T.1992a. Canopy structure, nitrogen distribution and whole canopy photosynthetic carbon gain in growing and flowering stands of tall herbs. Vegetation 102: 173–181. [Google Scholar]
- SchievingF, Pons TL, Werger MJA, Hirose T.1992b. The vertical distribution of nitrogen and photosynthetic activity at different plant densities in Carex acutiformis Plant and Soil 14: 9–17. [Google Scholar]
- ShiraiwaT, Sinclair TR.1993. Distribution of nitrogen among leaves in soybean canopies. Crop Science 33: 804–808. [Google Scholar]
Associated Data
This section collects any data citations, data availability statements, or supplementary materials included in this article.


