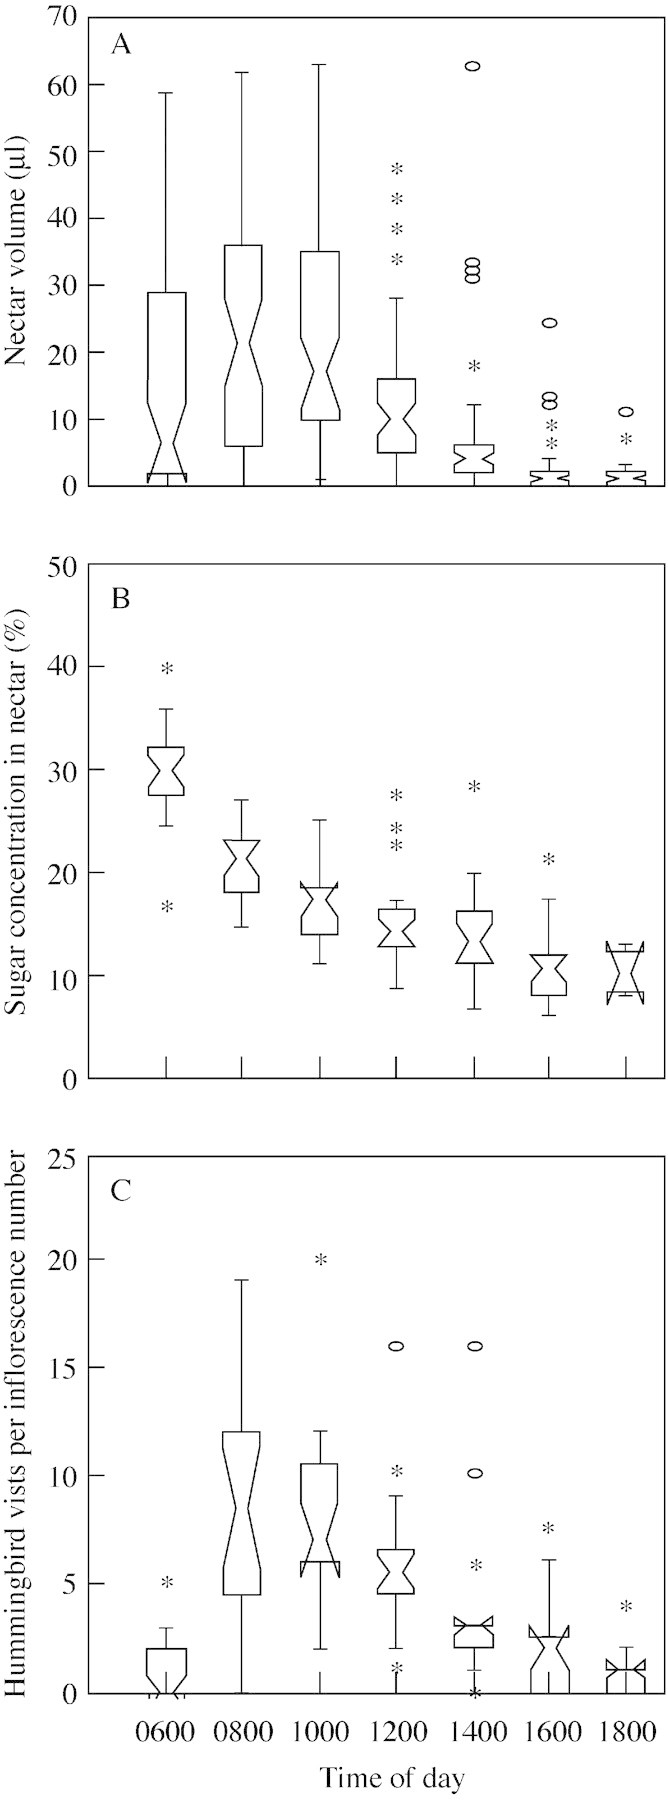
Fig. 2. Nectar features and number of visits in Aechmea pectinata. A, Variation in nectar volume. B, Sugar concentration in nectar. C, Number of hummingbird visits per inflorescence. The boxes represent the inter quartile range and their centres the medians. The interval between the slanted lines around the medians is the 95 % confidence limit. Inferior and superior vertical lines represent the total range of the distribution (25 and 75 %). Extreme values are represented by asterisks, and outliers by open circles. Overlap between boxes indicates no statistical difference.
