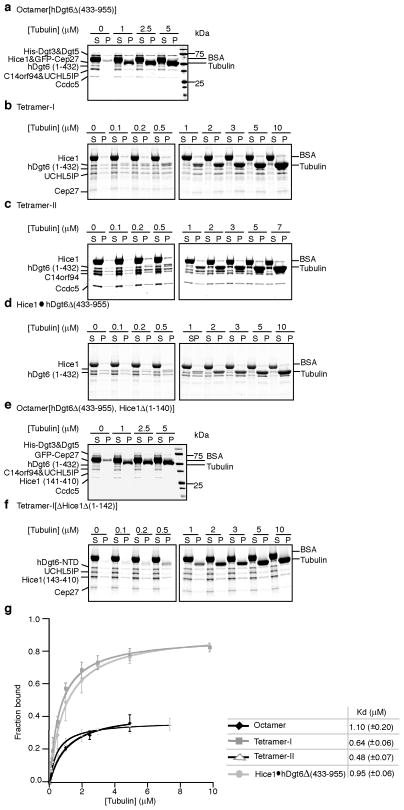
Figure 4.
Analyses microtubule binding by augmin complexes. SDS-PAGE analysis of microtubule co-sedimentation assays for octamer[hDgt6Δ (433–955)] (a), tetramer-I (b), tetramer-II (c), Hice1·hDgt6Δ (433–955) (d), octamer[hDgt6Δ (433–955), Hice1Δ (1–140)] (e), and tetramer-I[Hice1Δ (1–142)] (f). BSA (final 0.25 mg/ml), used to suppress non-specific interactions, and tubulin are indicated. (g) Analysis of microtubule binding by octamer[hDgt6Δ (433–955)] (◆), tetramer-I (
 ), tetramer-II (Δ), and Hice1·hDgt6Δ (433–955) (
 ). For the octamer, band intensities of His-Dgt3&Dgt5, C14orf94, UCHL5IP, and Ccdc5 from the SDS-PAGE gels were used to determine average fraction protein bound. For tetramer-I, band intensities of hDgt6 (1–432), UCHL5IP, and Cep27 were used to determine average fraction protein bound. For tetramer-II, band intensities of C14orf94, and Ccdc5 were used to determine average fraction bound. For the dimer, only the hDgt6 (1–432) band intensity was used to determine fraction protein bound. Microtubule binding constants were determined by fitting to a hyperbola. Due to limited amounts of octamer [hDgt6Δ (433–955)] available, co-sedimentation experiments were repeated twice. For the tetramer-I, -II and dimer, three independent experiments were analyzed. Error bars show S.D.

