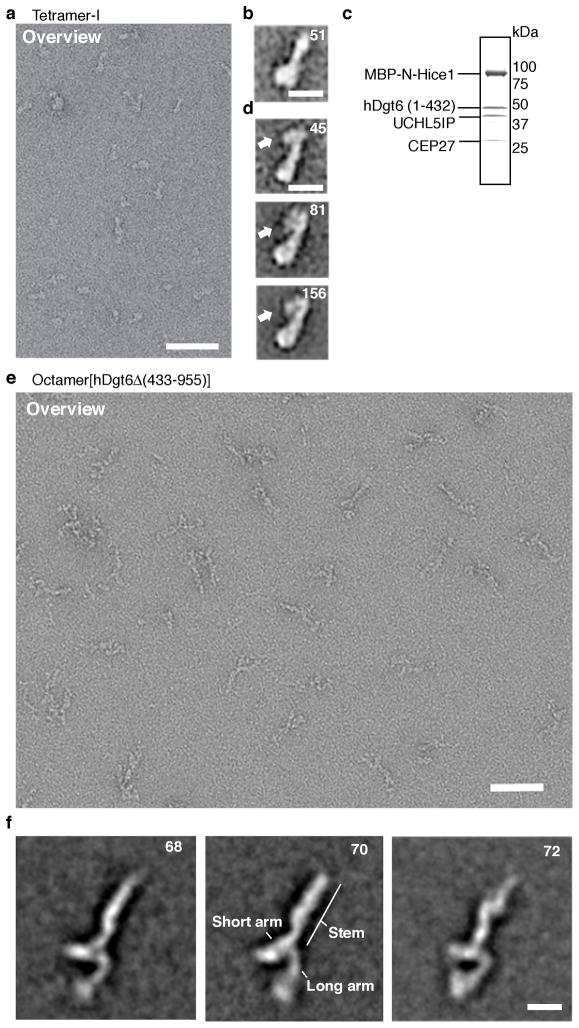
Figure 5.
2-D class averages of augmin complexes examined by electron microscopy. (a) Negative stain electron micrograph of tetramer-I (Hice1·hDgt6 (1–432)·UCHL5IP·Cep27) particles. A field of particles adsorbed onto a glow-discharged carbon grid was stained with 2% (w/v) uranyl acetate and processed for imaging. Scale bar, 50 nm. (b) A representative two-dimensional class average image of tetramer-I particles (N=51). Scale bar, 10 nm (c) SDS-PAGE analysis (stained with Coomassie blue) of purified tetramer-I with MBP-tagged Hice1 N-terminus. (d) Three representative class averages of the MBP-tagged tetramer-I (MBP-Hice1·hDgt6 (1–432)·UCHL5IP· Cep27) particles (N=45, 81 and 156) are shown. The position of the MBP-tag is indicated (arrow). Scale bar, 10 nm (e) Negative stain electron micrograph of octamer[hDgt6Δ (433–955)] particles. A field of octamer[hDgt6Δ (433–955)] particles adsorbed onto a glow-discharged carbon grid was stained with 2% (w/v) uranyl acetate and processed for imaging. Scale bar, 50 nm. (f) Representative class averages of the octamer[hDgt6Δ (433–955)] particles (N=68, 70 and 72). Prominent structure features are indicated. Scale bar, 10 nm.

