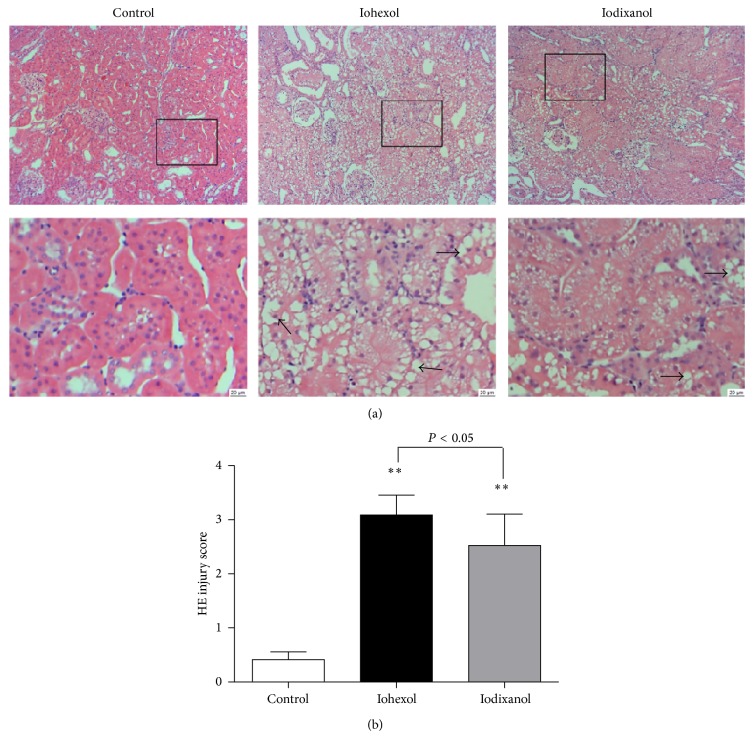
Figure 6.
Iohexol resulted in more severe morphological injury compared with iodixanol in 5/6 NE rats. (a) Representative photomicrographs of tubular cell injury (arrow) in rat kidney tissue sections of the control, iohexol, and iodixanol groups. (b) Quantitative analysis of histologic scoring. Original magnifications: ×100. Hematoxylin and eosin stain. Calibration bar = 20 μm. ** P < 0.01 versus the control group; n = 8.

