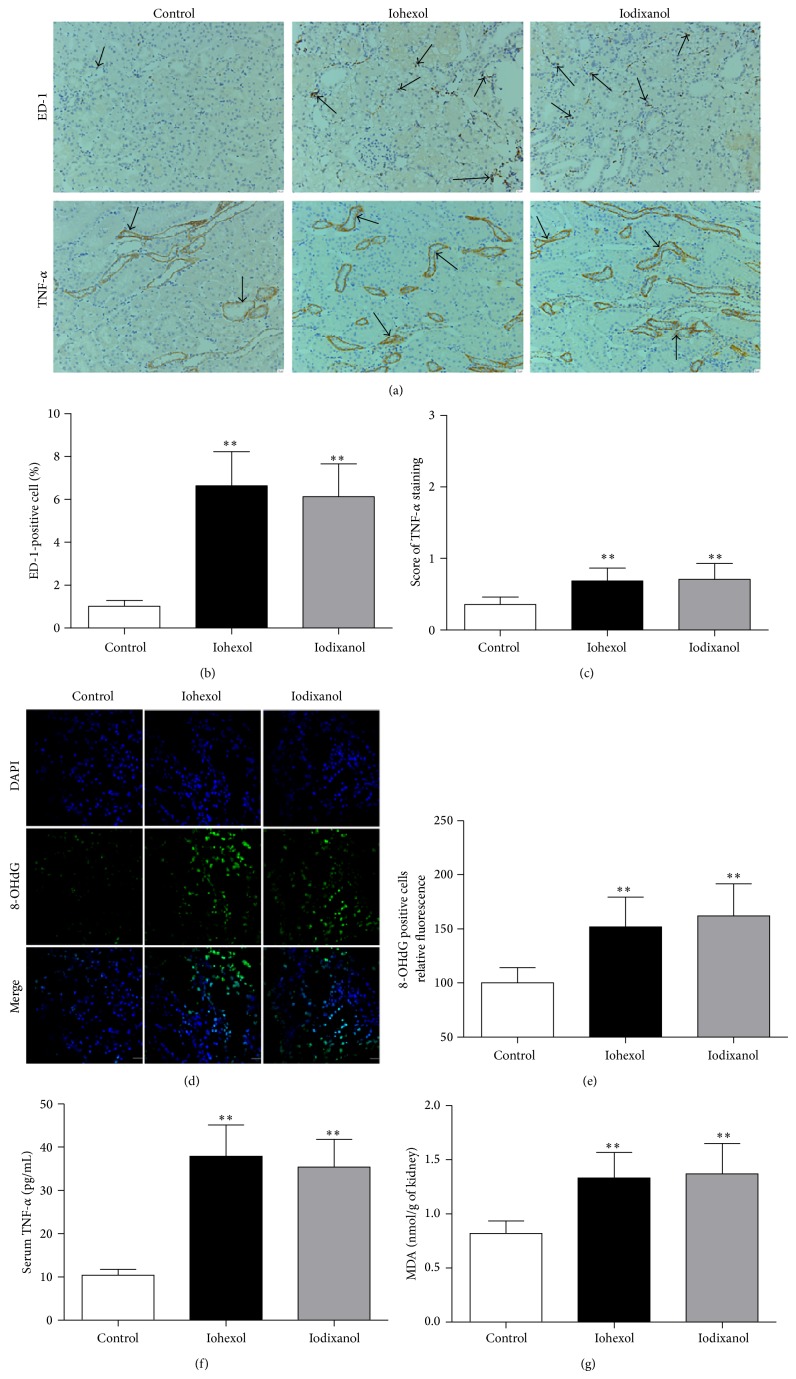
Figure 7.
Iohexol and iodixanol resulted in similarly marked increases in inflammation and oxidative stress levels. (a) Representative photomicrographs of immunostaining for ED-1 and TNF-α in the renal sections of the control, iohexol, and iodixanol groups. Brown color indicates positive staining (arrow). (b) Quantitative analysis of ED-1-positive cells in the three groups by the percentage of ED-1-positive cells. (c) Quantitative analysis of the extent and intensity of TNF-α staining. (d) Representative photomicrographs of immunofluorescent labeling (green) for the redox product oxidized derivative of 8-OHdG in the renal sections of the control, iohexol, and iodixanol groups. Nuclei were stained with DAPI (blue). (e) Quantitative analysis of the extent and intensity of 8-OHdG-positive cells. (f) Serum TNF-α levels. (g) MDA concentrations in renal tissues. Original magnifications: ×200 (a); ×630 (d). Calibration bar = 20 μm. ** P < 0.01 versus the control group; n = 8.

