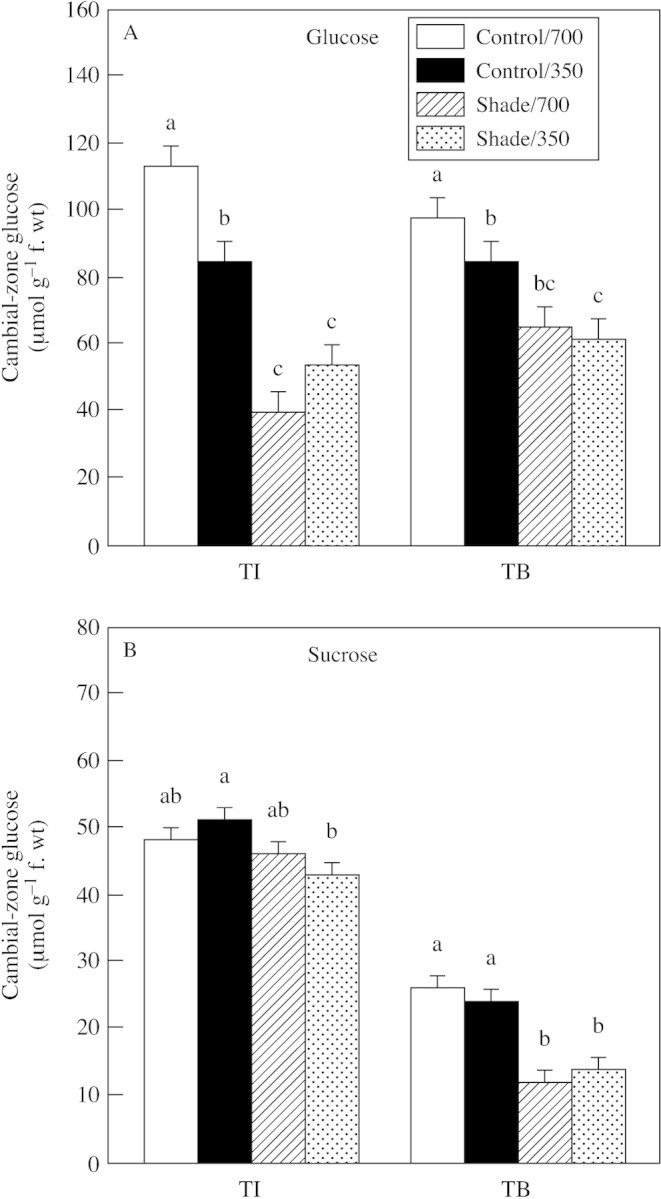
Fig. 6. Glucose (A) and sucrose (B) concentrations in cambial zones of tubers produced in plants exposed to light (shade or control illumination) and CO2 (350 or 700 µmol mol–1) treatments at tuber initiation (TI) and tuber bulking (TB). Plants were harvested 2 (TI) or 4 weeks (TB) after transfer to short days, with exposure to treatments for 2 weeks prior to harvest in each case. Bars represent the s.e.m. Means labelled with different letters differ significantly (P ≤ 0·05).
