
Figure 5.
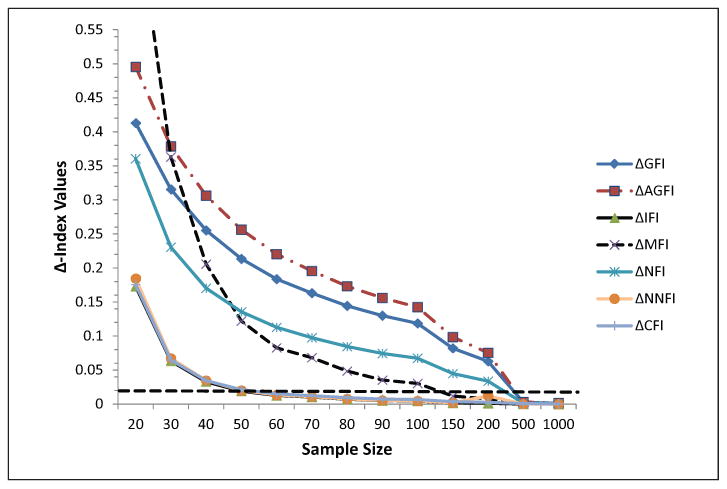
Δ-Index values as a function of sample size. The dashed line indicates a cutoff value of .02 as suggested by Fan and Sivo (2009). Estimates are based on simulating the responses from the Simos et al. (2013) functional magnetic resonance imaging study.