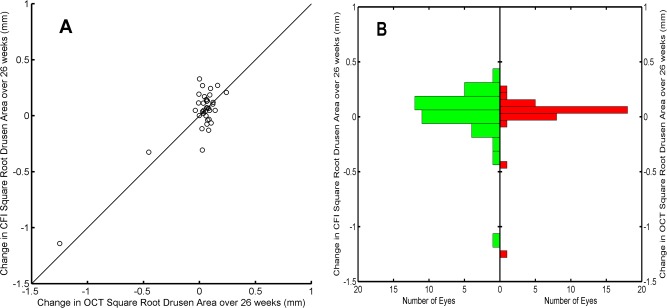
Figure 5.
Changes in square root drusen area (SQDA) measurements within the central 3-mm circle over 26 weeks. (A) Change in SQDA was obtained using spectral-domain optical coherence tomography (SDOCT) images versus changes in SQDA obtained using color fundus images (CFIs). Solid line is the bisector. (B) Histograms of the changes in SQDA as measured with CFIs (left) and SDOCT (right).

