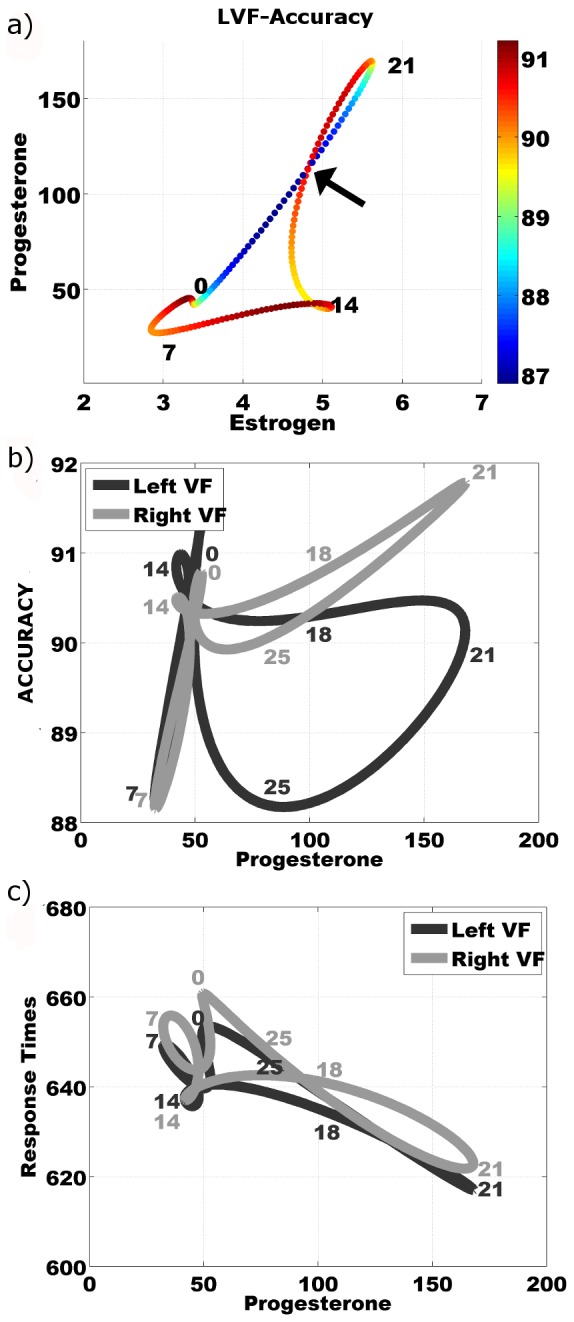
Figure 2. Phase plane plots of data averaged across participants.

Numbers next to the line on the plot indicated the approximate day of a normalized 28 day cycle. Following a single plot allows one to follow data through a 28 day cycle. a) Phase plane plot of group's normalized (to 28 day) estrogen and progesterone saliva concentrations across the menstrual cycle. Colour indicates group's average Left Visual Field Accuracy (LVF-ACC) as percentage of trials where a correct response was given. The arrow indicates point where estrogen and progesterone values are equal but LVF-ACC is different. b) Group average LVF-ACC and RVF-ACC plotted against group average changes progesterone in a normalized 28 day cycle. c) Group average LVF-RT and RVF-RT plotted against group average changes progesterone in a normalized 28 day cycle.
