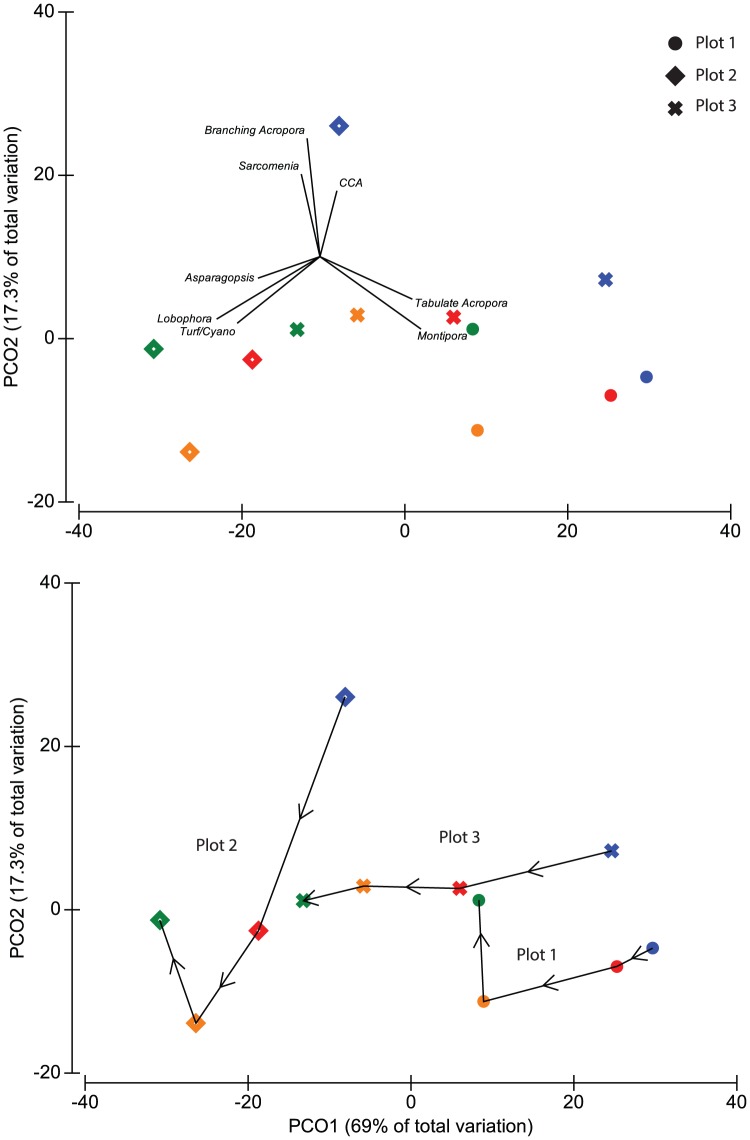
Figure 3. Principal coordinates plot of shifts in composition of dominant benthic taxa from 2010–2013.
Shapes indicate the different plots (circles = plot 1, diamonds = plot 2 and crosses = plot 3, while colours indicate different years (blue = 2010, red = 2011, orange = 2012 and green 2013). A general trend of declines in plating corals and increased macroalgae were observed in all plots, although coral decline was most pronounced in plot 3. Declines in plating corals were offset by increases in branching Acropora in plots 1 and 2 between 2012 and 2013.

