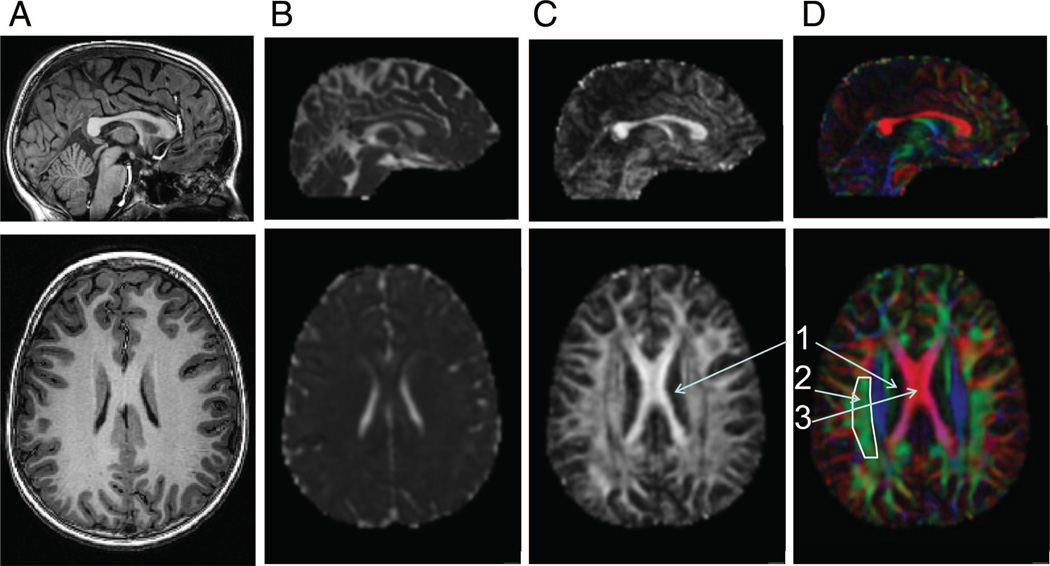
Figure 2.
Sagittal (top) and axial (bottom) slices from a healthy 12-year-old girl. (A) Conventional T1 weighted anatomical image. (B) Mean diffusivity map calculated from diffusion tensor imaging data. High signal (white areas) represents high diffusion (cerebral spinal fluid); low signal (gradations of dark areas) represents reduced diffusion (gray and white matter). (C) Fractional anisotropy map calculated from diffusion tensor imaging data. High signal (white areas) represents high fractional anisotropy (white matter); low signal (dark areas) represents reduced anisotropy (gray matter and cerebral spinal fluid). (D) Red-Green-Blue map calculated from diffusion tensor imaging data. Voxels displayed as red represent tracts with primarily left-right orientation (x-axis); voxels displayed as green represent tracts with primarily anterior-posterior orientation (y-axis); voxels displayed as blue represent tracts with primarily superior-inferior orientation (z-axis). The superior longitudinal fasciculus, a tract containing fibers projecting along the y-axis (outlined in white, see Fig. 1B) is represented in green. The corpus callosum, a tract containing fibers projecting along the x-axis, is represented in red (see Fig. 1C).

