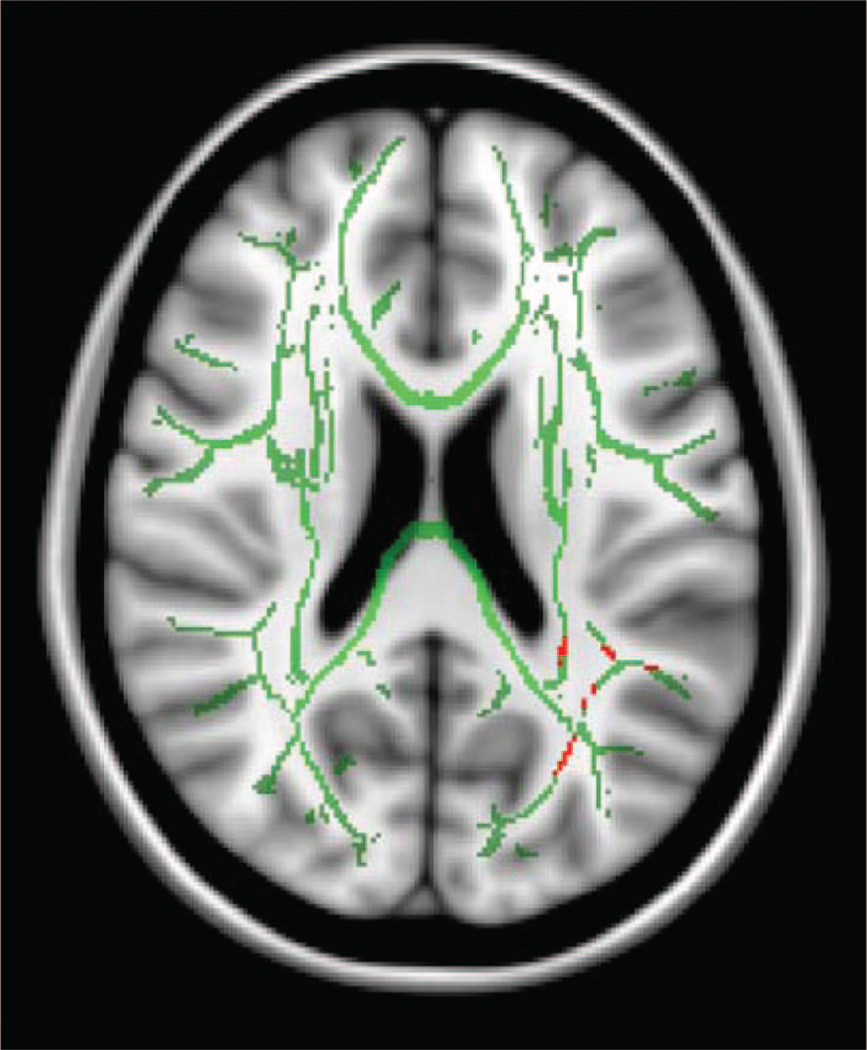
Figure 3.
Mean fractional anisotropy skeleton, in green, generated from Tract Based Spatial Statistics for a sample of 13 children born prematurely and 12 age-matched full-term controls, overlaid on a Montreal Neurologic Institute template. Regions of significant difference in fractional anisotropy (p < .05, uncorrected for multiple comparisons) between children born prematurely and controls are shown in red within the skeleton.

