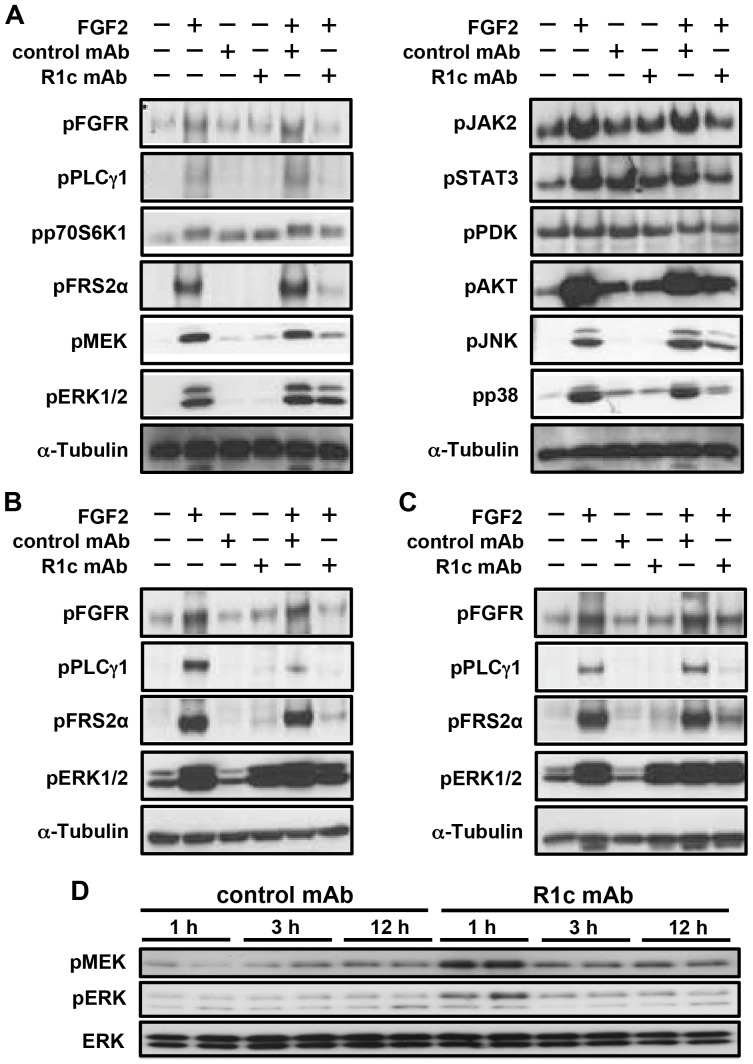
Figure 2. FGFR1c mAb effects on FGFR and intracellular downstream signalling.
Representative Western blot analyses on FGFR1c (R1c) mAb (50 µg/ml), control mAb (50 µg/ml) and FGF2 (10 ng/ml) treated (A) mouse embryonic hypothalamic N46 cells, (B) undifferentiated 3T3-L1 cells and (C) differentiated 3T3-L1 cells (D). White adipose tissue Western blot analyses after treatment of female diet-induced obese (DIO) mice with a single injection of either R1c mAb or control mAb (10 mg/kg i.v.). The mice were fasted during the treatment period.

