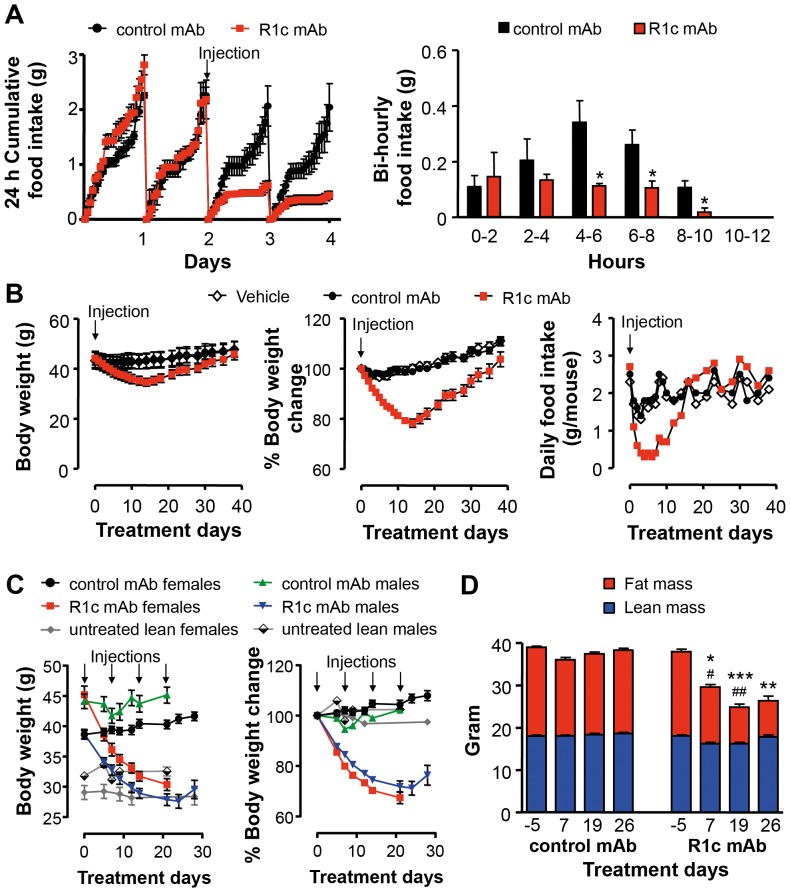
Figure 3. FGFR1c mAb effects on food intake, body weight and body composition.
(A) 24 h cumulative food intake and Bi-hourly food intake during the first 12 h following a single injection of either R1c mAb or control mAb in female DIO mice (n = 4, 10 mg/kg i.p. indicated with an arrow). *P<0.05 vs. control mAb, Mann Whitney U-test. (B) Body weight (n = 4), percent body weight change (n = 4) and food intake (n = 1, group housed animals) following a single injection of either vehicle, R1c mAb or control mAb in female DIO mice (10 mg/kg s.c. indicated with an arrow). (C) Body weight and body weight change following repeated injections of either R1c mAb or control mAb in female or male DIO mice (n = 7–8, 10 mg/kg i.p. once weekly indicated with arrows) compared with untreated lean mice on chow diet (n = 8–10). (D) Quantitative assessment of body fat mass and body lean mass by dual-energy X-ray absorptiometry in female DIO mice (n = 7, 10 mg/kg i.p. day 0, 7, 14 and 21). *P<0.05, **P<0.01, and ***P<0.001 R1c mAb fat mass vs. control mAb fat mass and # P<0.05, and ## P<0.01 R1c mAb lean mass vs. control mAb lean mass at corresponding treatment day, Mann Whitney U-test. Values are means ± SEM.

