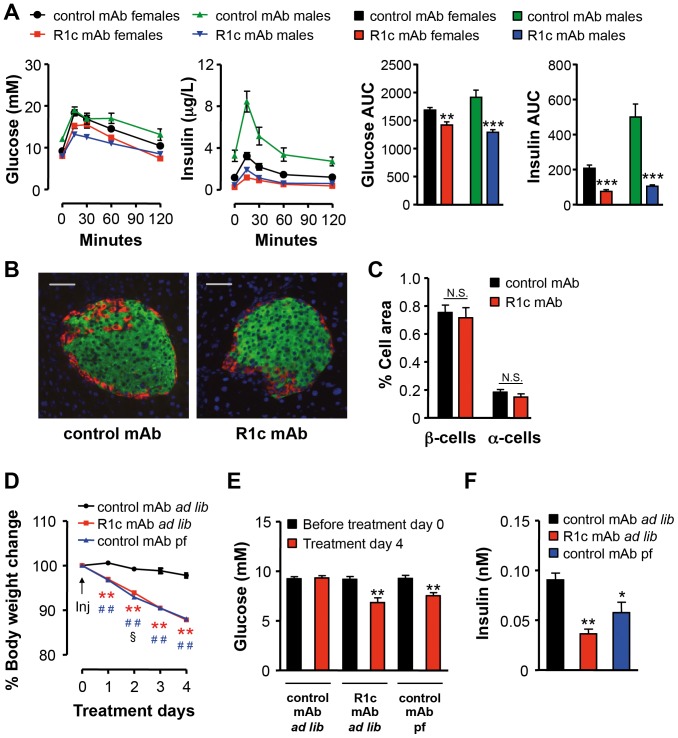
Figure 4. FGFR1c mAb effects on glucose tolerance and pancreatic islet cell mass.
(A) Oral glucose tolerance test (OGTT) 15 d after repeated injections of either R1c mAb or control mAb in female or male DIO mice (n = 7–8, three i.p. injections 10 mg/kg on day 0, 7 and 14). Glucose and insulin area under the curve (AUC) were calculated. **P<0.01 and ***P<0.001 vs. respective control mAb, Mann Whitney U-test. (B) Representative pancreatic islet staining of insulin (green), glucagon (red), and nucleuses (blue), and (C) β and α cell quantification after repeated injections with either R1c mAb or control mAb in female DIO mice after 28 d treatment (n = 7, 10 mg/kg i.p. day 0, 7, 14 and 21). N.S. = Non Significant. (D) Percent body weight change after a single injection of R1c mAb in female DIO mice fed ad libitum (ad lib) or control mAb treated female DIO mice fed ad lib or pair-fed (pf) twice daily to match the food intake in R1c mAb treated female DIO mice fed ad lib (n = 6, 3 mg/kg s.c., indicated with an arrow). **P<0.01 R1c mAb ad lib vs. control mAb ad lib, ## P<0.01 control mAb pf vs. control mAb ad lib, and § P<0.05 R1c mAb ad lib vs. control mAb pf, Mann Whitney U-test. (E) Effects on 3 h fasting glucose levels before treatment start day 0 and after 4 d treatment. **P<0.01 vs. Treatment day 0 within respective treatment group, Mann Whitney U-test. (F) Effects on 3 h fasting insulin levels after 4 d treatment. *P<0.05, **P<0.01 vs. Control mAb fed ad lib, Mann Whitney U-test. Values are means ± SEM.

